ACSA RESEARCH
Where Are My People? Native American, First Nations & Indigenous in Architecture
Kendall A. Nicholson, Ed.D., Assoc. AIA, NOMA, LEED GA
ACSA Director of Research and Information
February 26, 2021
Architecture is a discipline inextricably tied to the land on which we live. This land has a story and uncovering the racial disparities across the continent is one way to tell it. Where Are My People? is a research series that investigates how architecture interacts with race and how the nation’s often ignored systems and histories perpetuate the problem of racial inequity. Where Are My People? Native and Indigenous in Architecture chronicles both societal and discipline specific metrics in an effort to highlight the experiences of Native American, First Nations, Alaskan Native, Métis, Inuit and other Indigenous designers, architects, and educators. This research report follows the first three parts of the series, Where Are My People? Black in Architecture, Where Are My People? Hispanic and Latinx in Architecture, and Where Are My People? Asian American, Native Hawaiian, and Pacific Islander in Architecture.
Our inquiry always starts by asking questions. Who are the indigenous peoples of North America? How do they engage with the built environment? How is Indigenous design different than what is traditionally taught in school or built in practice? Why is it that the original inhabitants of this land have limited access to resources? Let’s start with the history.
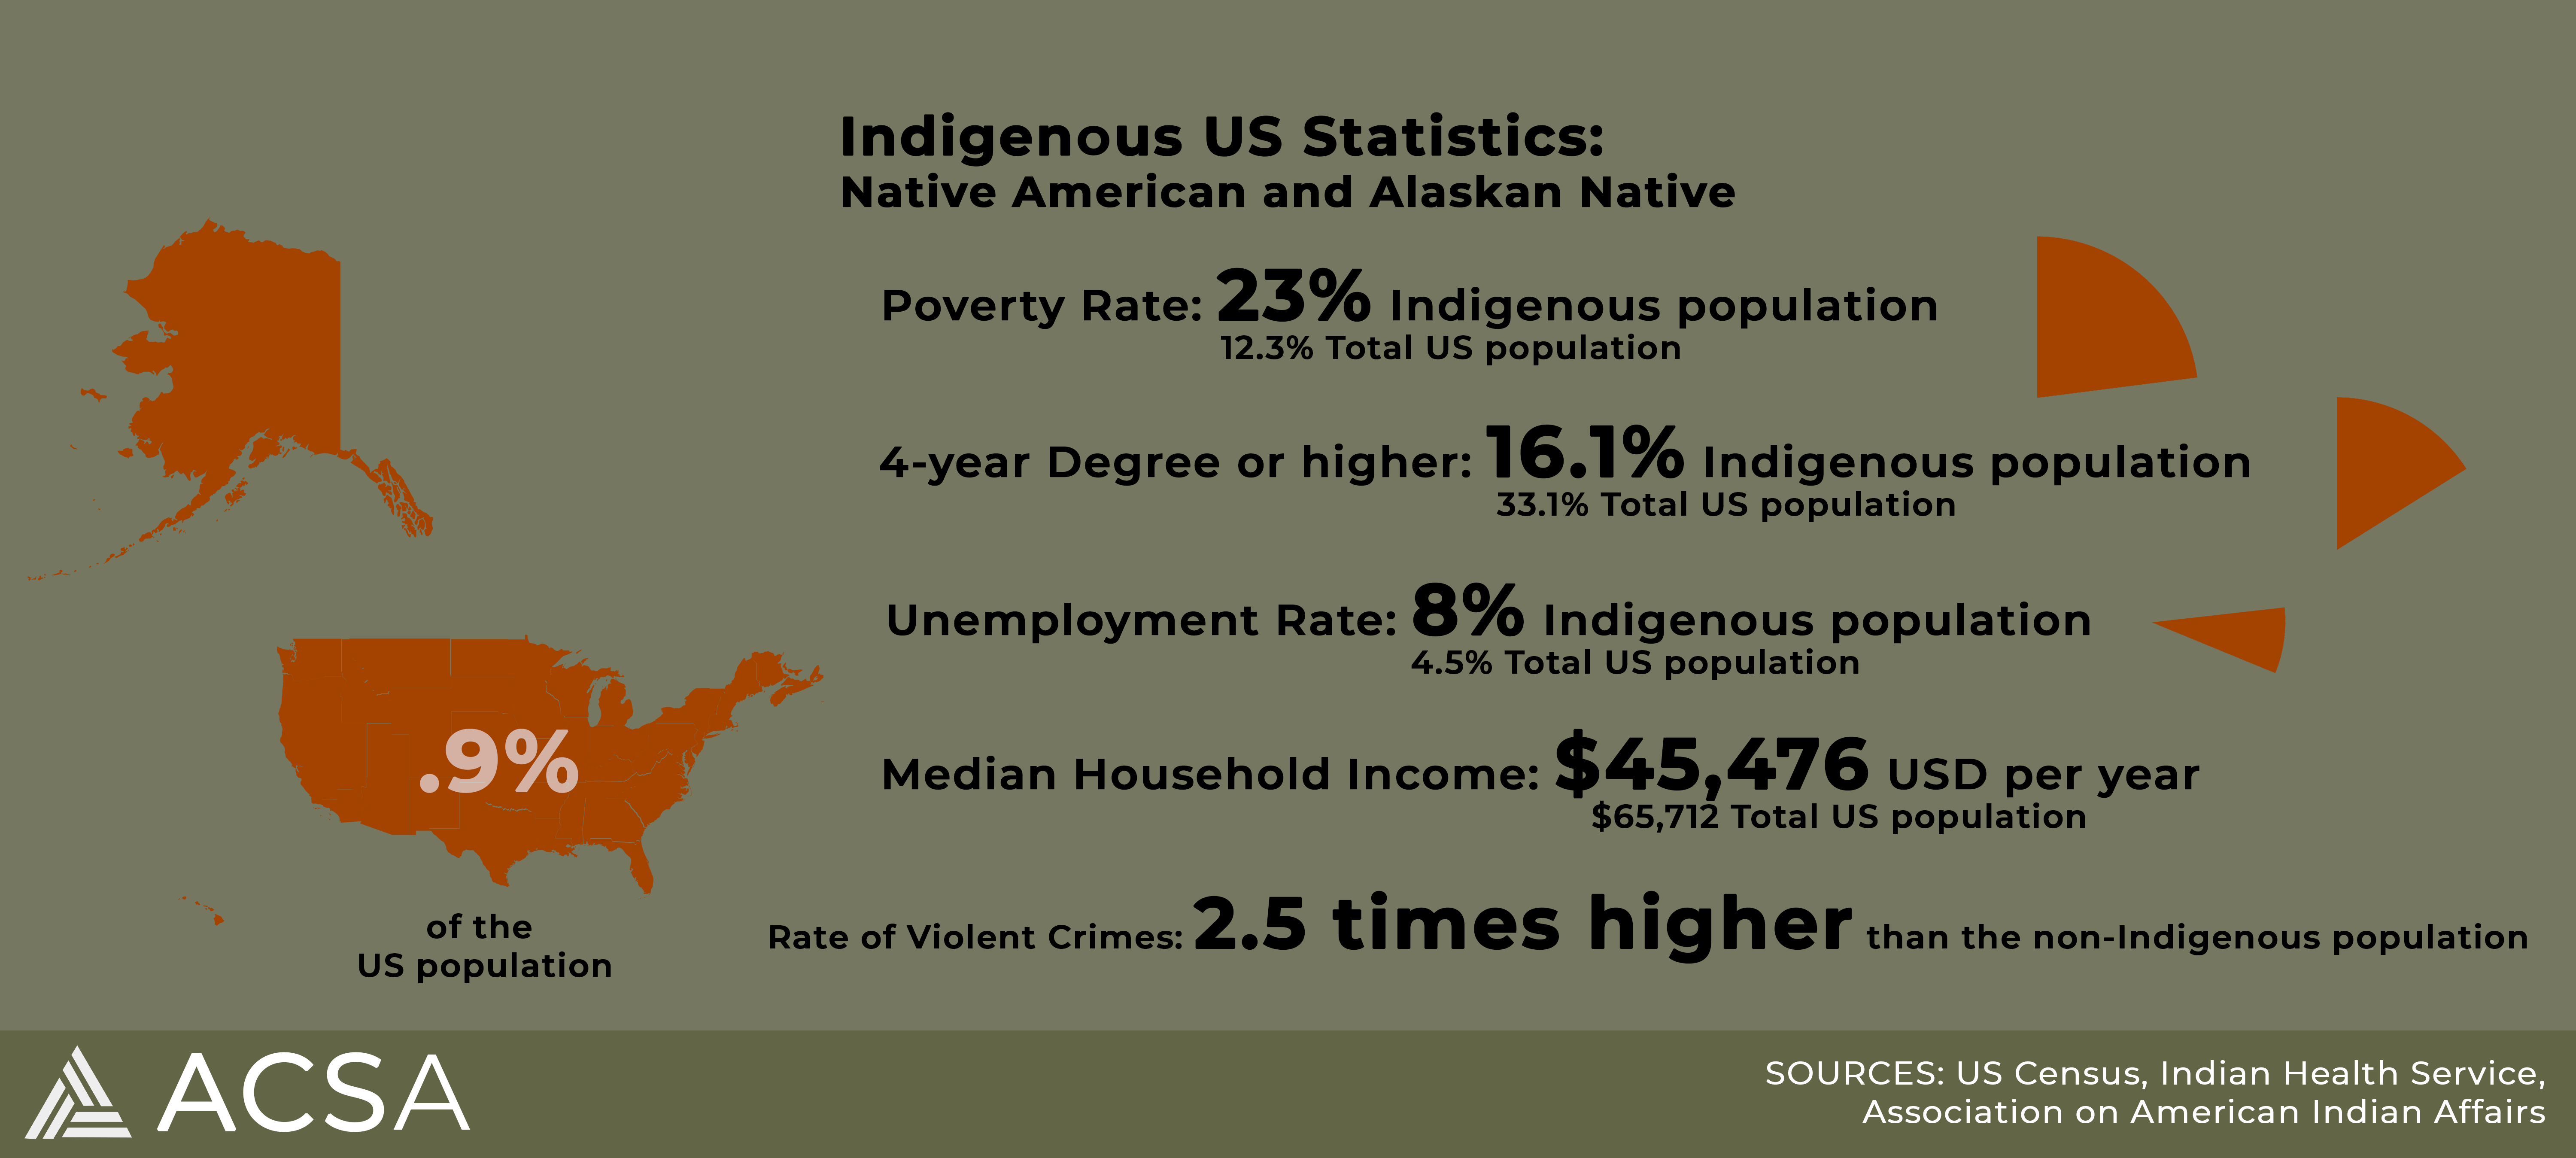
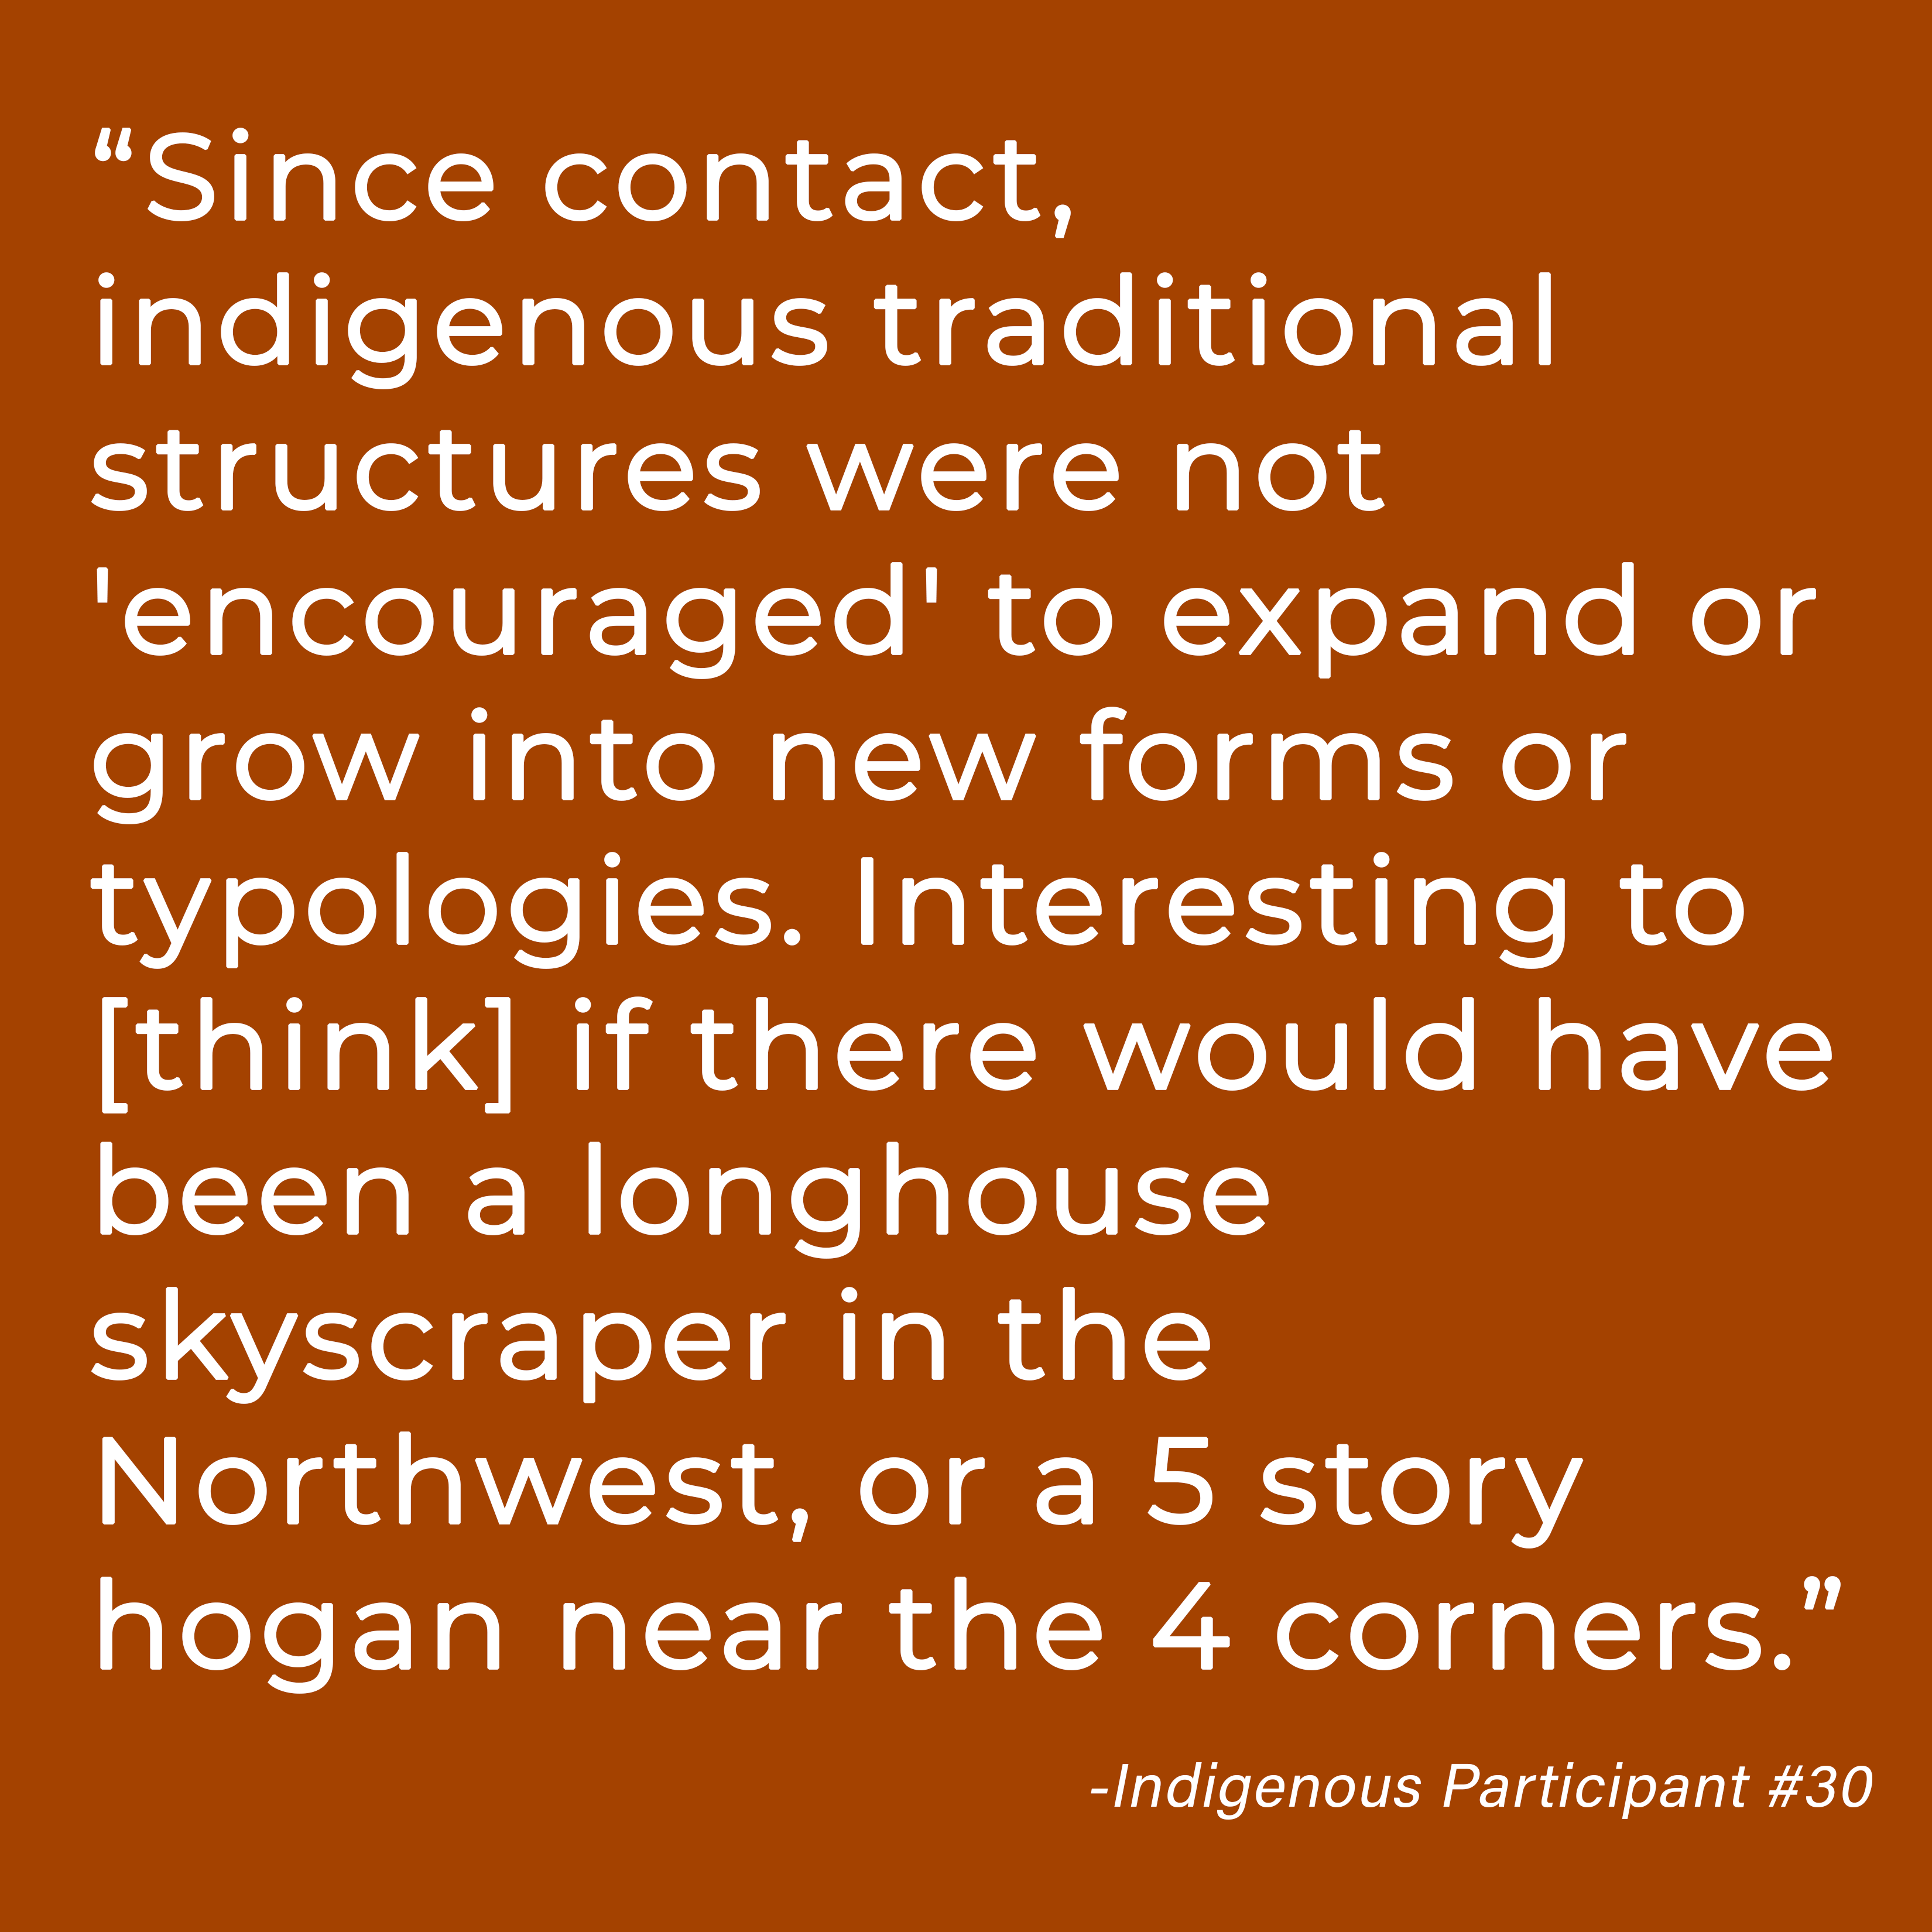
Today, the United States federal government recognizes 568+ Native American tribes and Alaskan Native corporations across the country. Theses sovereign entities represent the millions of Native and Indigenous people who once occupied what is now the United States of America. The story of Indigenous peoples dates back thousands of years, but the recent history of European colonialization begins in the 15th and 16th century when Spanish and English explorers arrived and attempted to enslave and colonize Native peoples. Encounters during this time wiped out large numbers of the indigenous population by way of disease and war. The next 200+ years are marked by Native resistance and English control, as demonstrated by the founding of the first Native American reservation in 1638, and the first U.S. treaty with a Native American tribe in 1778. Put plainly, Native peoples were removed from their homelands in the name of “Westward Expansion” and, in doing so, left with few resources that did not require complete assimilation. The genocide of Indigenous peoples has a direct impact on the statistics shown above.
According to the U.S. Census, the median household income for Indigenous people is approximately $20,000 less per year. Subsequently, nearly 1 in 4 people who identify as American Indian or Alaskan Native are considered at or below the poverty line. (For reference, I have included those thresholds below.)
United States | |
| Persons in family/household | Poverty Guidelines |
| 1 person | $12,760 |
| 2 persons | $17,240 |
| 3 persons | $21,720 |
| 4 persons | $26,200 |
| 5 persons | $30,680 |
| 6 persons | $35,160 |
| 7 persons | $39,640 |
| 8 persons | $44,120 |
| For families/households with more than 8 persons, add $4,480 for each additional person. | |
Moreover, research uncovers statistics that correspond directly to the systemic harm Native people have endured. The recent history of children being forcibly removed from their homes and sent to “Indian boarding schools” in an attempt to strip the Native culture away from thousands of children has a long-lasting effect shown in modern day educational attainment figures. Indigenous peoples with a 4-year degree or higher (16.1%) is less than half that of the national average (33.1%). Additionally, the brutal treatment of Native peoples during the founding of the United States still manifests today. The rate at which Native peoples experience violent crimes is 2.5 times higher than the rate for other racial groups. It is imperative that we understand these data as it directly affects the way in which Native peoples navigate contemporary constructed environments.
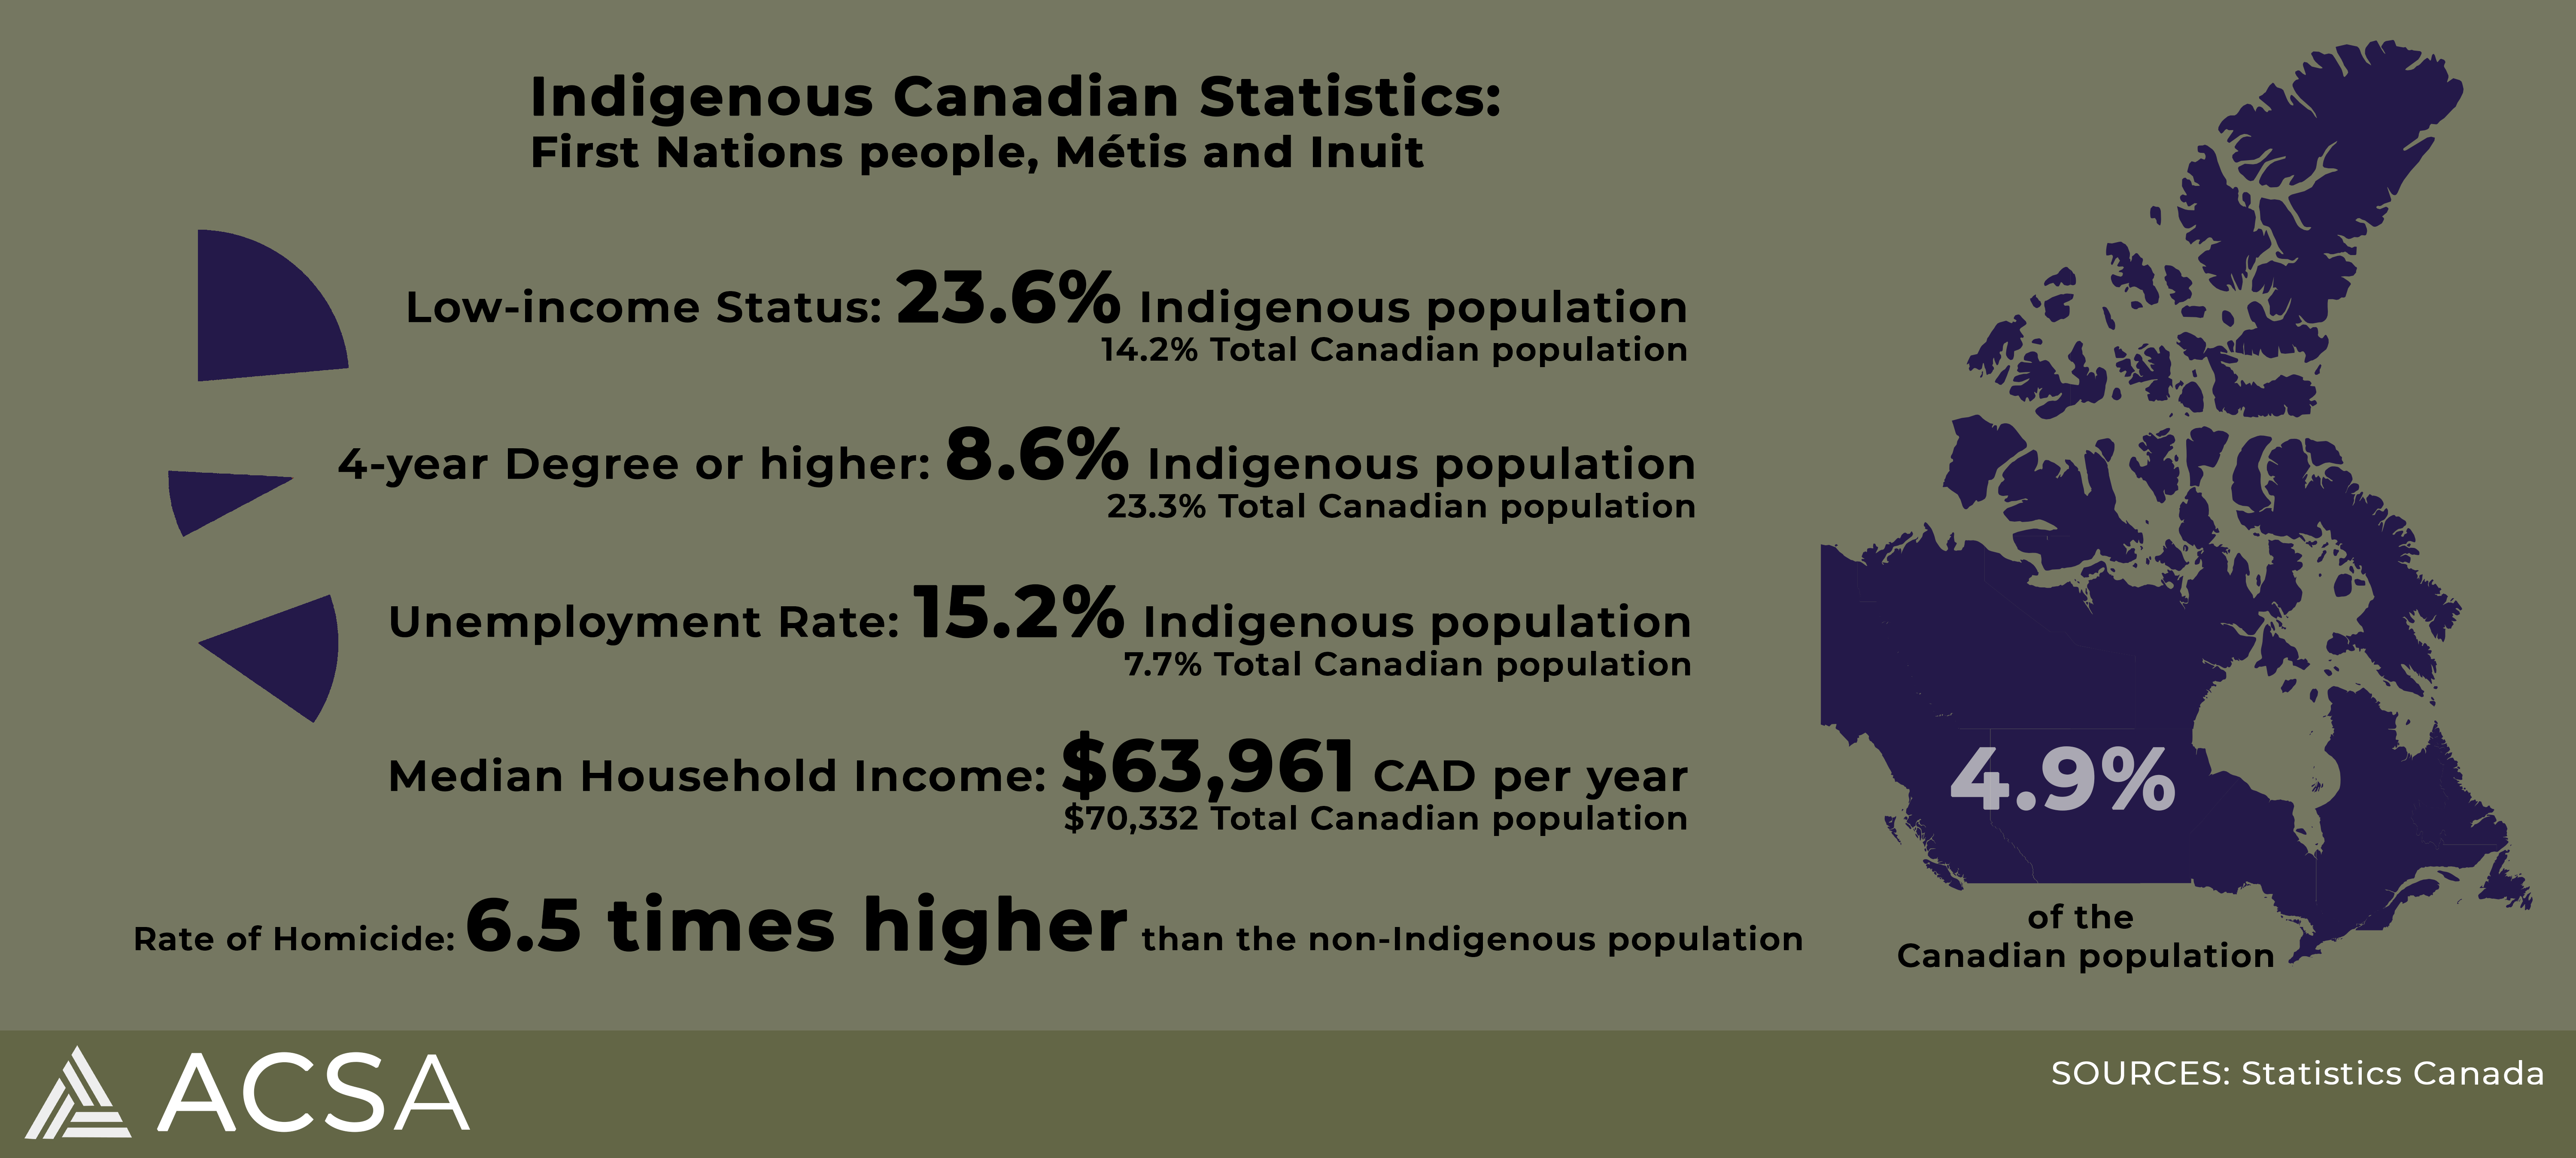
While the particular histories for Indigenous peoples are different, the systems at play are largely similar. Canada recognizes more than 600 Indigenous tribes and communities, each with their own language, traditions, ceremonies, and religions. Though the population is diverse, Indigenous Canadian peoples are enumerated by the Constitution Act into three main people groups: First Nations, Métis, and Inuit. The graphic above shows a series of social measures that mimic the statistics found in the United States. Heightened unemployment rates (15.2%) substantiate the increased rates of low-income status. “Low-income status” as a designation is parallel to “poverty lines” in the United States. Low-income status thresholds are reported below.
| Canada | |
| Household size | 2018 constant dollars |
| 1 person | $24,183 |
| 2 persons | $34,200 |
| 3 persons | $41,886 |
| 4 persons | $48,366 |
| 5 persons | $54,075 |
| 6 persons | $59,236 |
| 7 persons | $63,982 |
| 8 persons | $68,400 |
| 9 persons | $72,549 |
| 10 persons | $76,473 |
The Canadian government estimates that nearly 150,000 Indian children were removed from their homes and sent to residential schools in the 20th century. This devastating practice supports current research citing lower levels of post-secondary educational pursuits (8.6%). Most alarming is the rate of homicide that is reported 6.5 times higher for Indigenous Canadians than for non-Indigenous Canadians. Indigenous communities have shown strength and resilience despite the intergenerational trauma that continues into today. This history of loss and removal has had significant impacts on both the architectural academy and the profession.
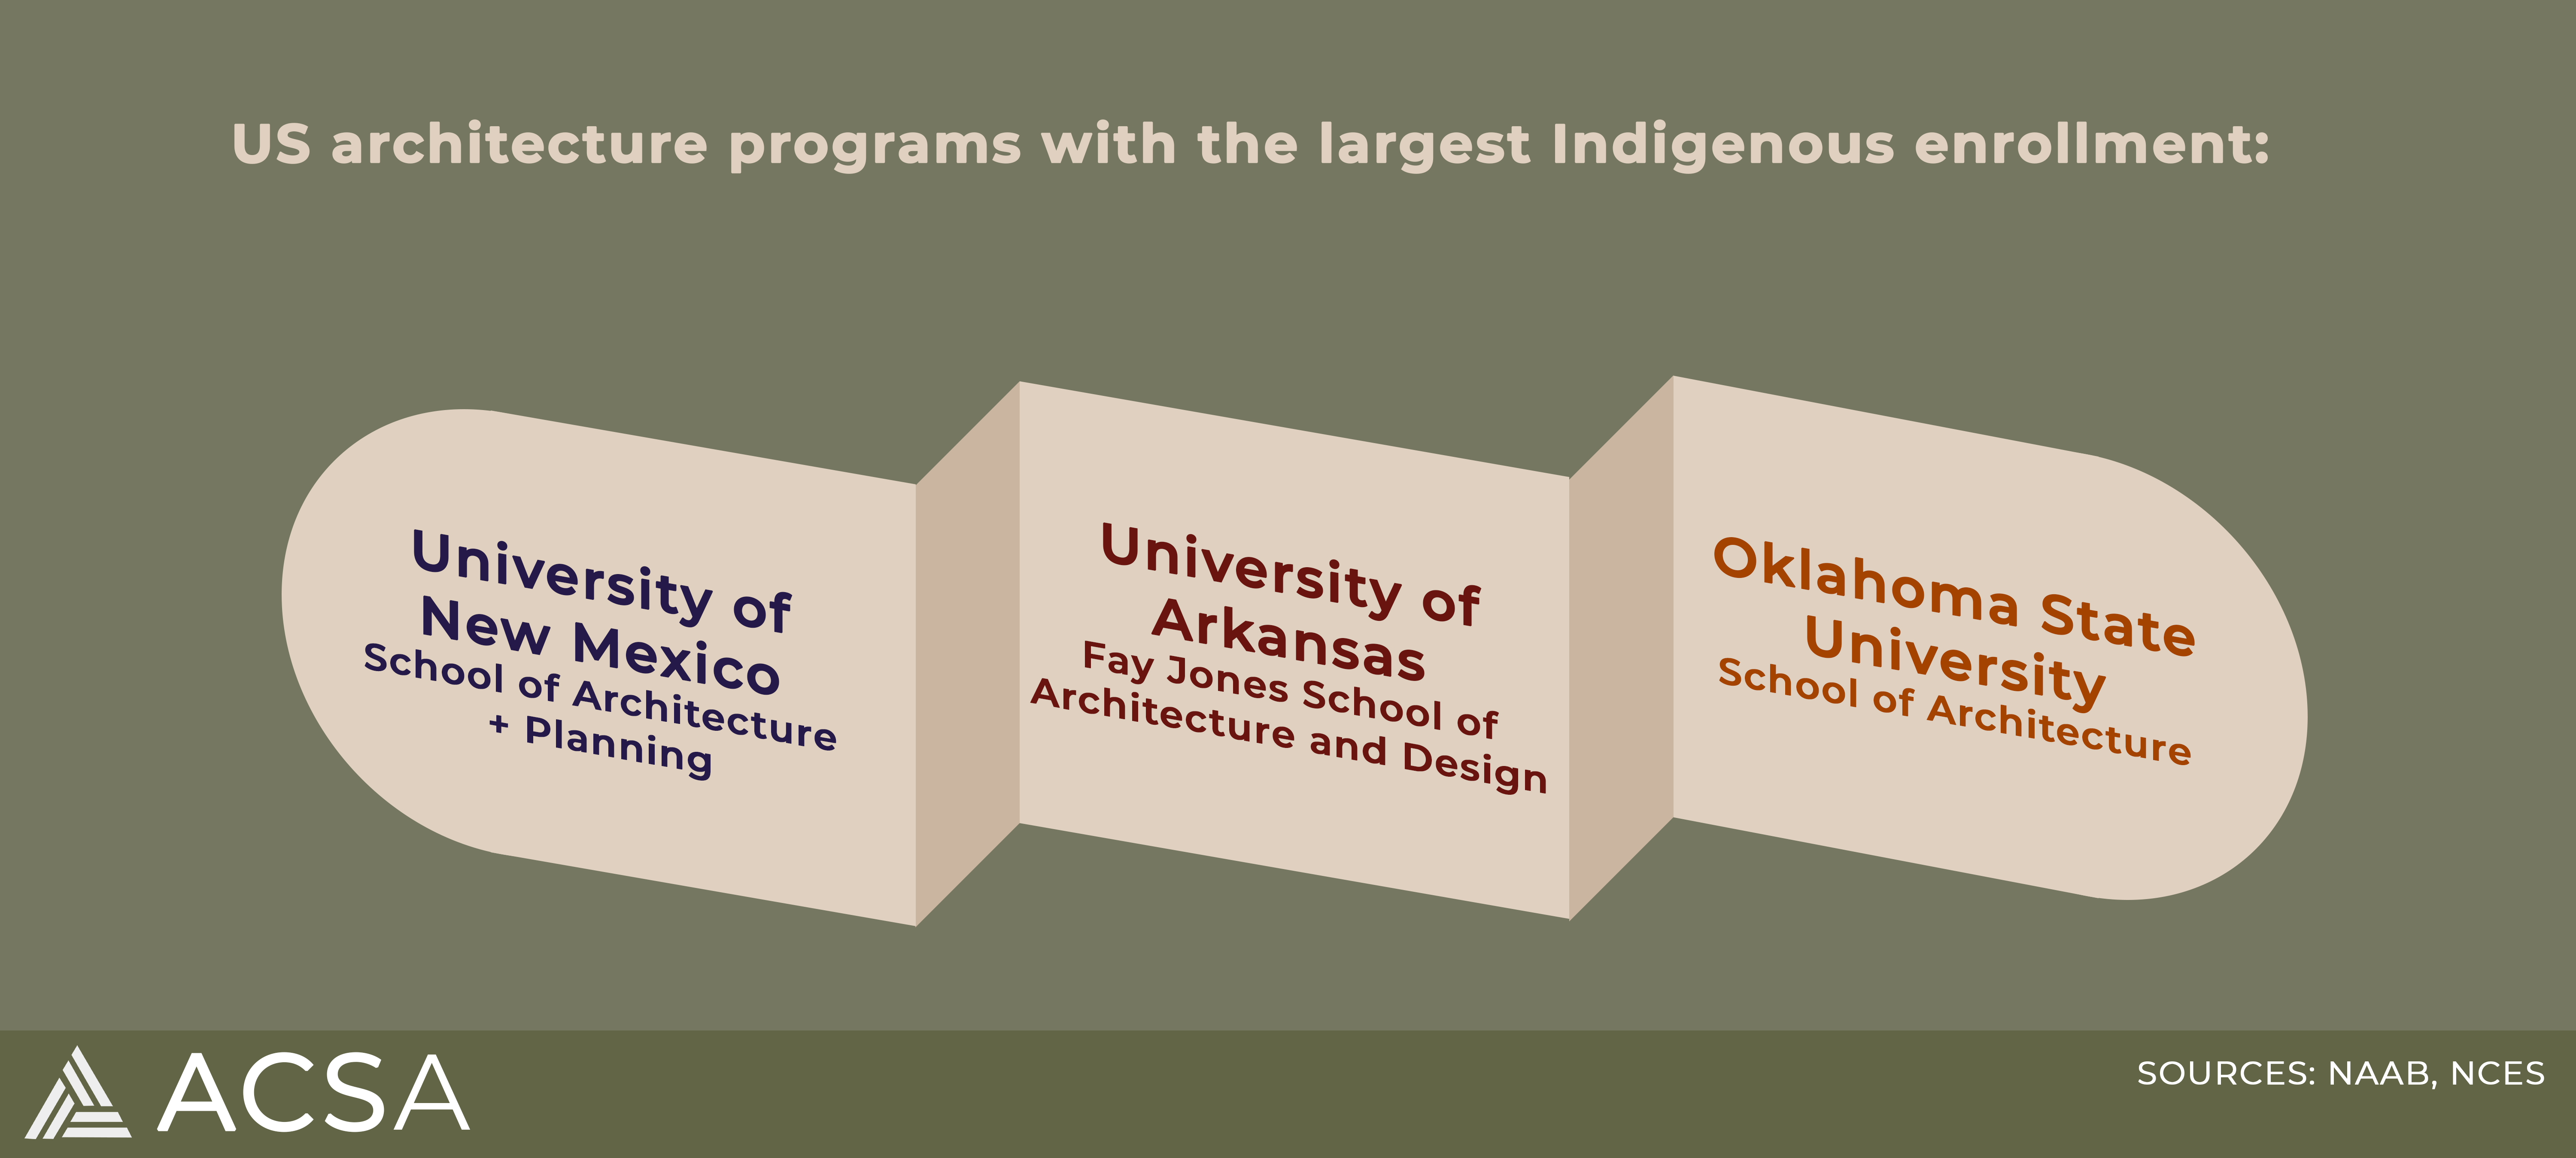
In an effort to identify where Native and Indigenous students enter the academy, we examined enrollment numbers. The research showed miniscule enrollment numbers at NAAB-accredited schools with many programs reporting either one or no Indigenous students. However, of the 139 accredited and candidate programs, the following schools admitted and retained more than 10 times the average number of Indigenous students: University of New Mexico, University of Arkansas, and Oklahoma State University. Sixty-three percent, or 87 of the 139 programs reported not enrolling any Indigenous students. The remaining 52 schools enroll 100% of the total Native and Indigenous student population in accredited and preprofessional programs. Corresponding to the small enrollment numbers are even smaller faculty numbers. NAAB-accredited programs report that 1.1% of tenure, tenure-seeking, general and adjunct faculty identify as Native or Indigenous. Unfortunately, we do not have access to student enrollment and faculty data for CACB programs.
When looking outside of the NAAB-accredited programs, to all of the architecture programs in the United States, most telling is the fact that fifty percent of the degrees awarded to Indigenous students in the discipline of architecture were postsecondary awards, certificates and diplomas that required less than 2 years to complete. This statistic is this highest of all the racial groups, towering (14%) above Black (36%) and Hispanic (36%) students graduating from architecture programs.
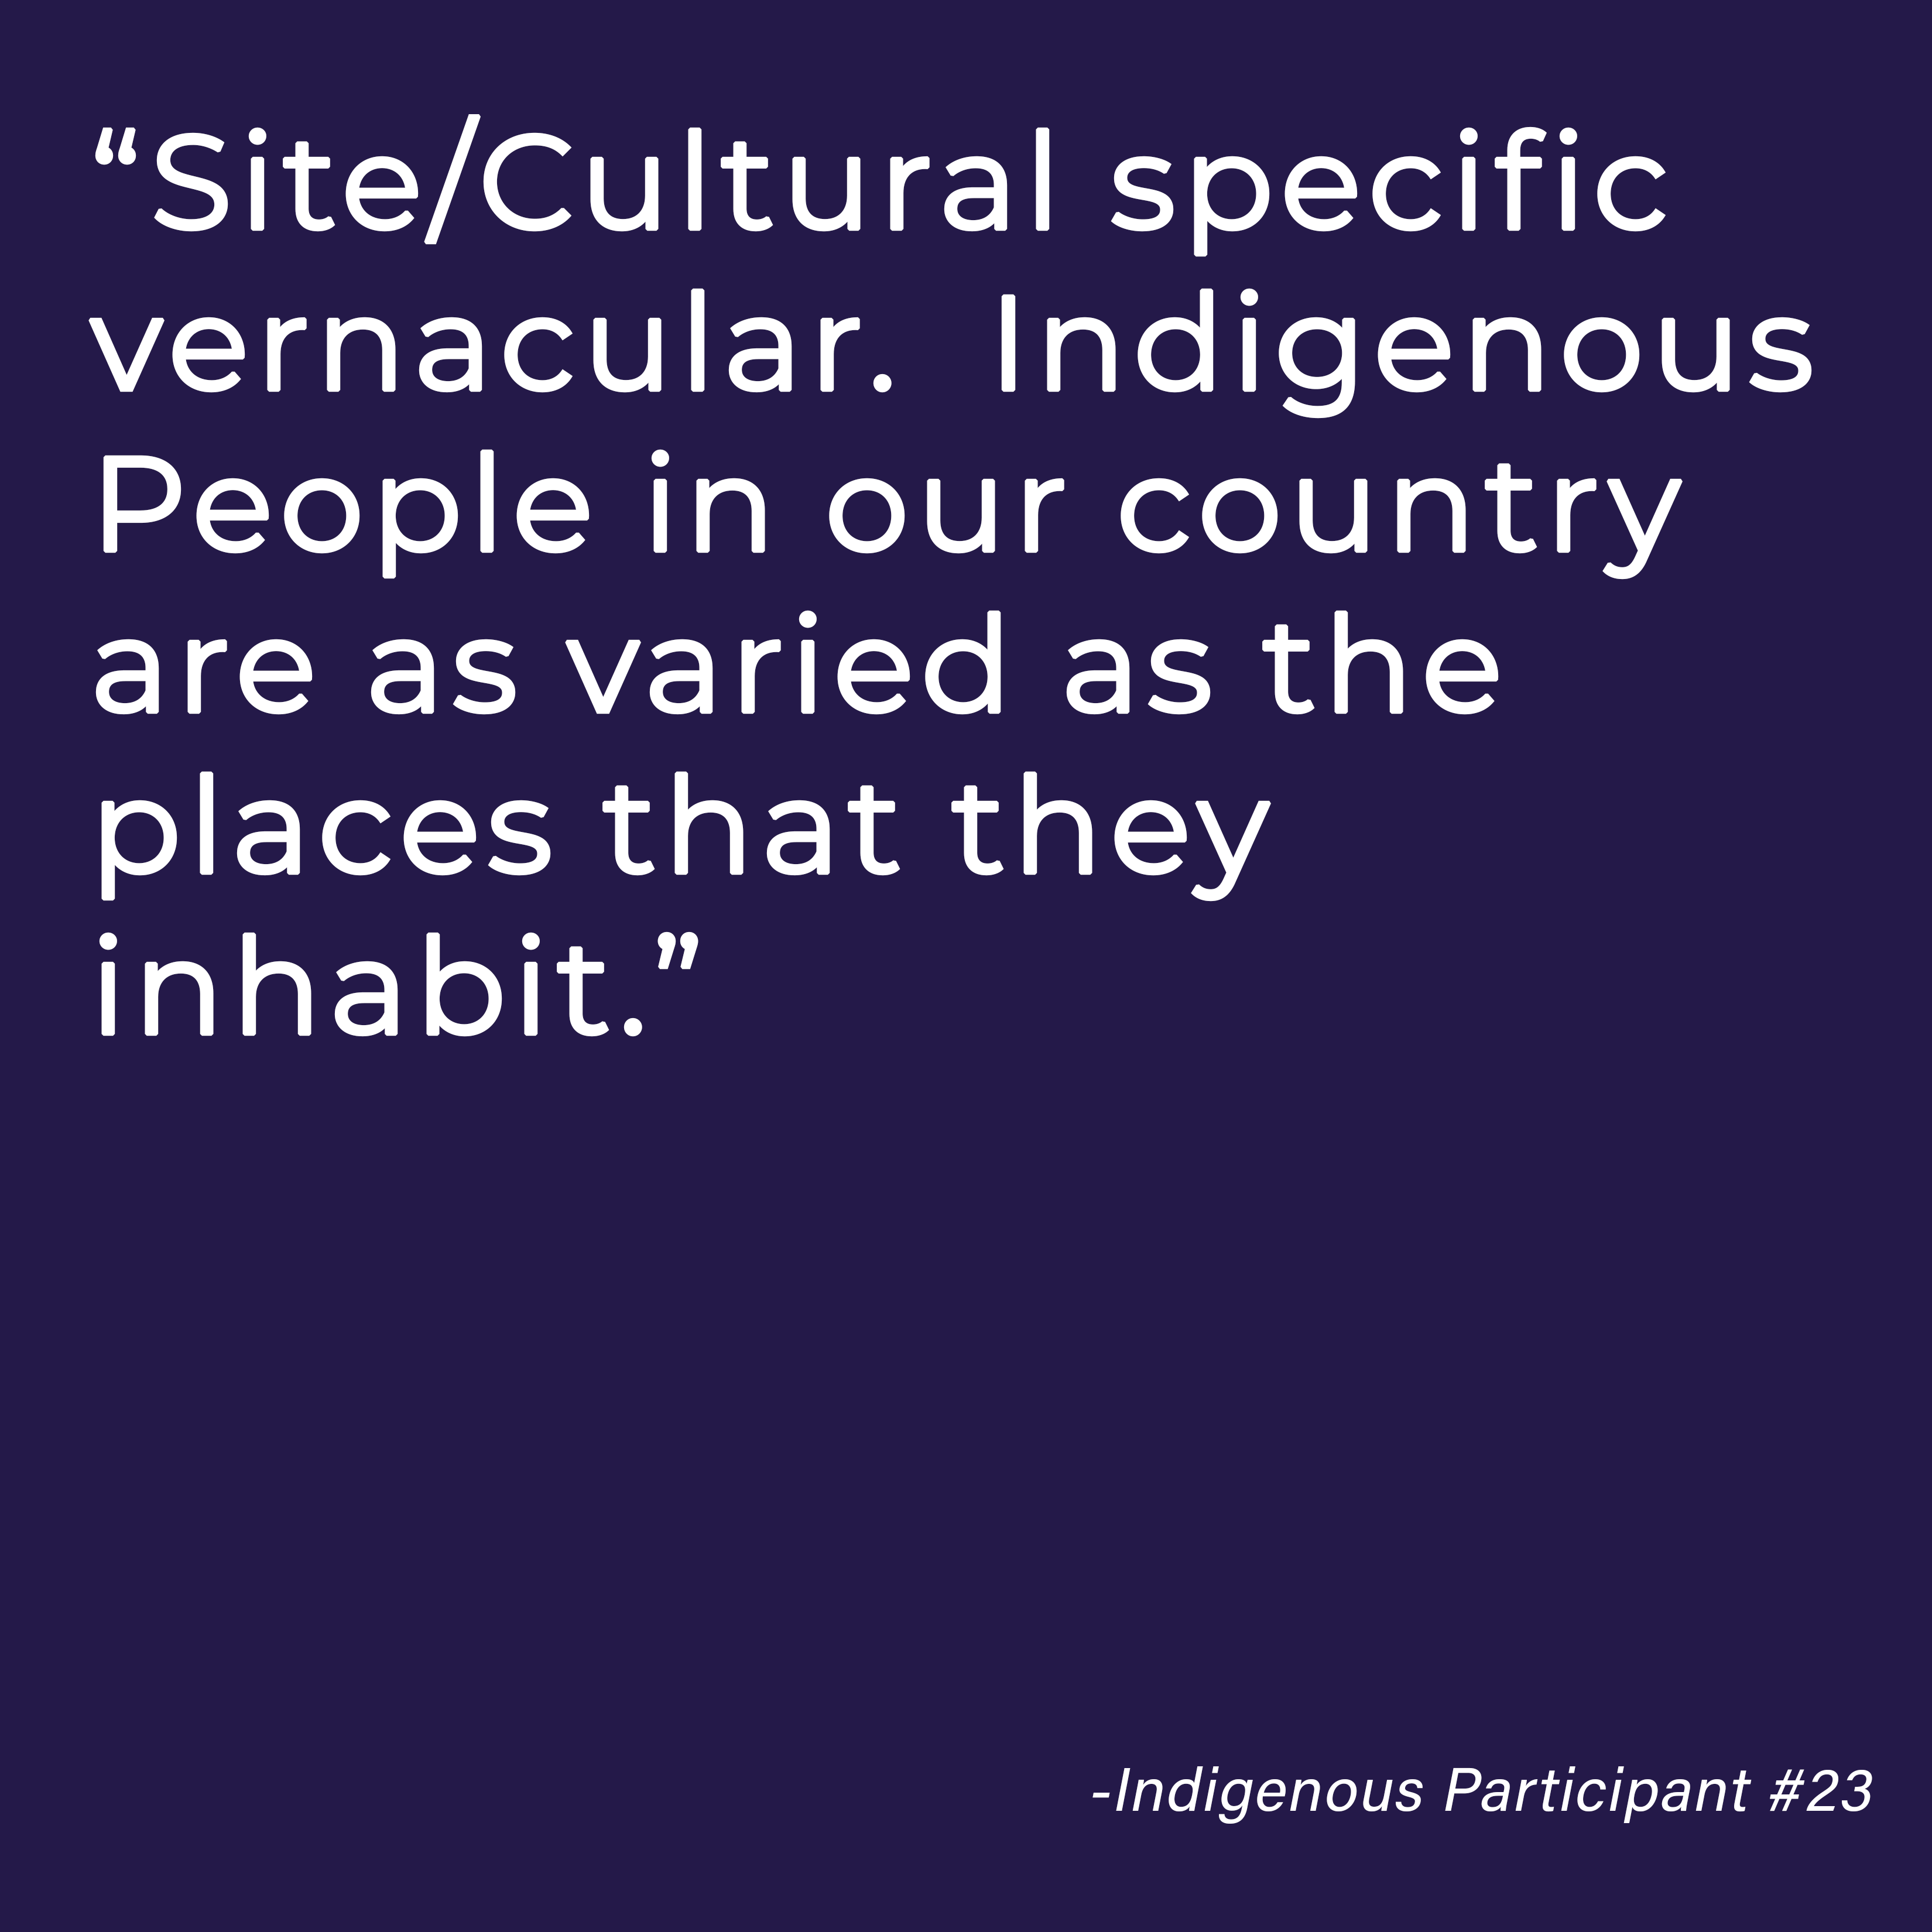
As previously mentioned, Native and Indigenous peoples are extremely diverse and as such ACSA recruited a convenience sample of 50 architects, designers and educators in an effort to accurately communicate the lived experience of people across the discipline. Because this one racial category is intended to capture the 1,200+ tribes and communities between Canada and the United States, we wanted qualitative data to help explain the nuances. This is impossible to do but the qualitative research below uncovered themes of misunderstanding, lack of recognition, as well as pride in the role of one’s Indigenous ancestors across the globe.
As previously mentioned, Native and Indigenous peoples are extremely diverse and as such ACSA recruited a convenience sample of 50 architects, designers and educators from 34 tribes in an effort to accurately communicate the lived experience of people across the discipline. Because this one racial category is intended to capture the 1,200+ tribes and communities between Canada and the United States, we wanted qualitative data to help explain the nuances. The qualitative research below uncovered misunderstanding, lack of recognition, as well as pride in the role of one’s Indigenous ancestors across the globe.
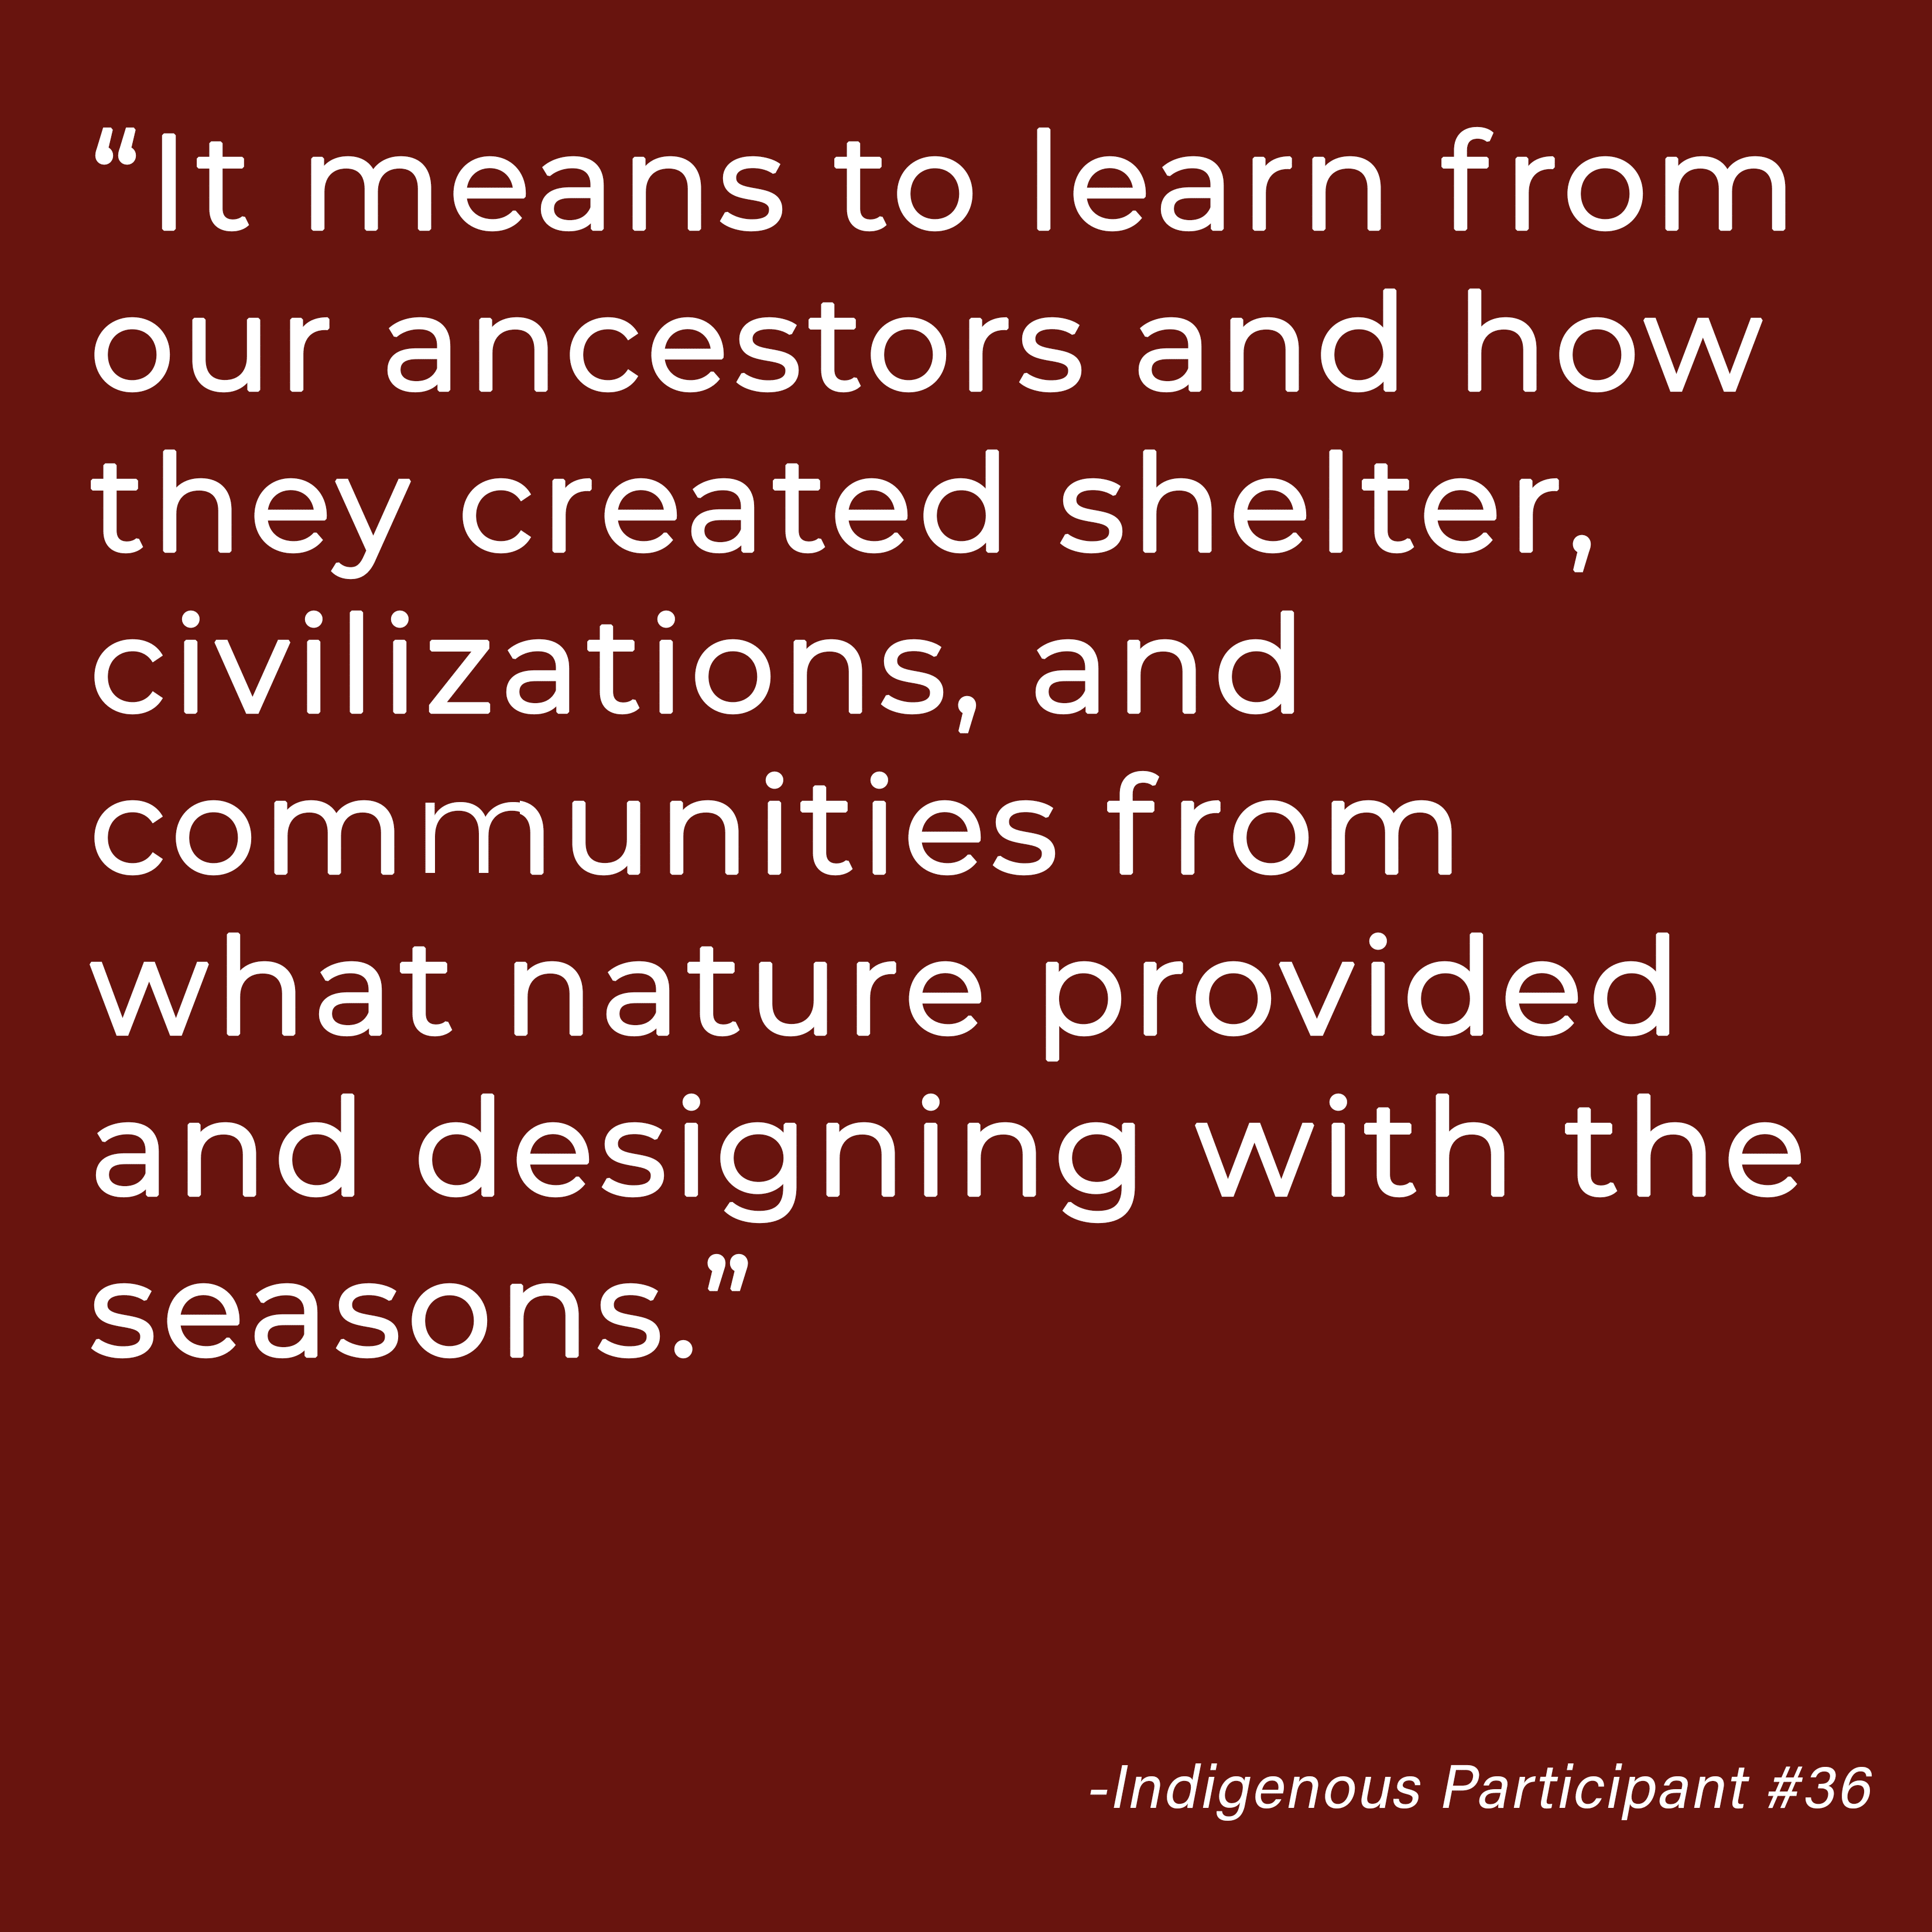
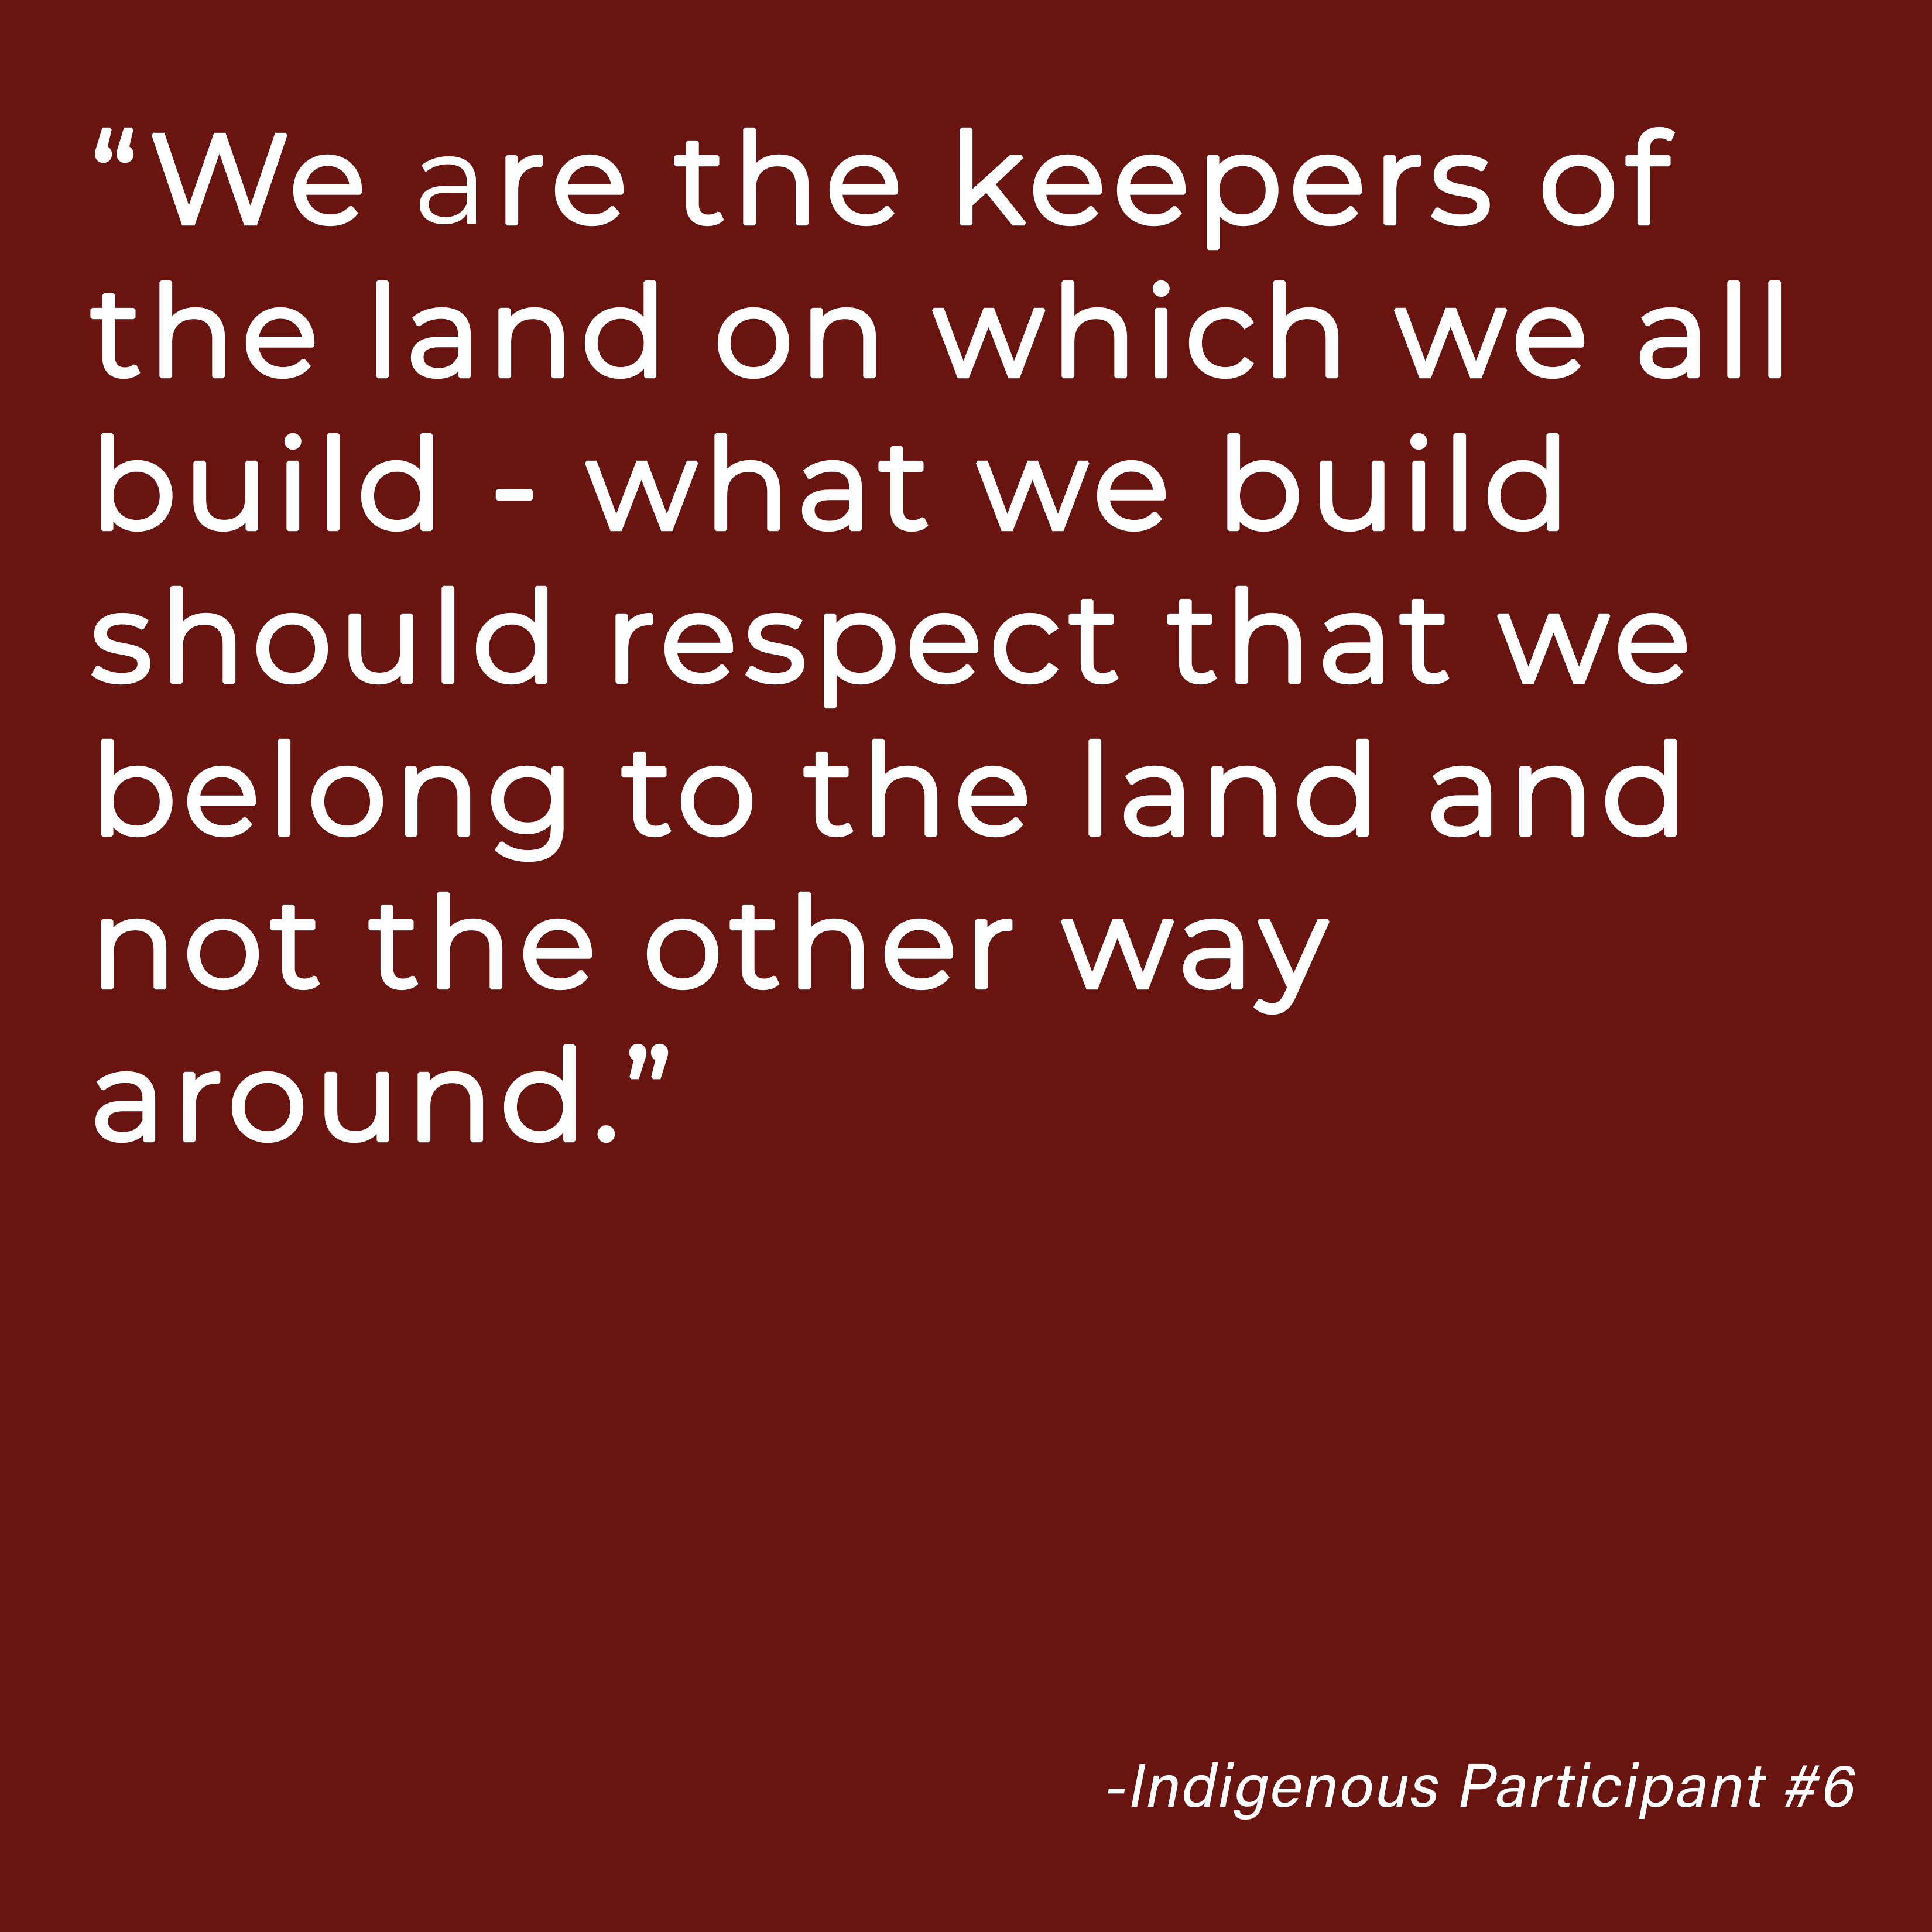
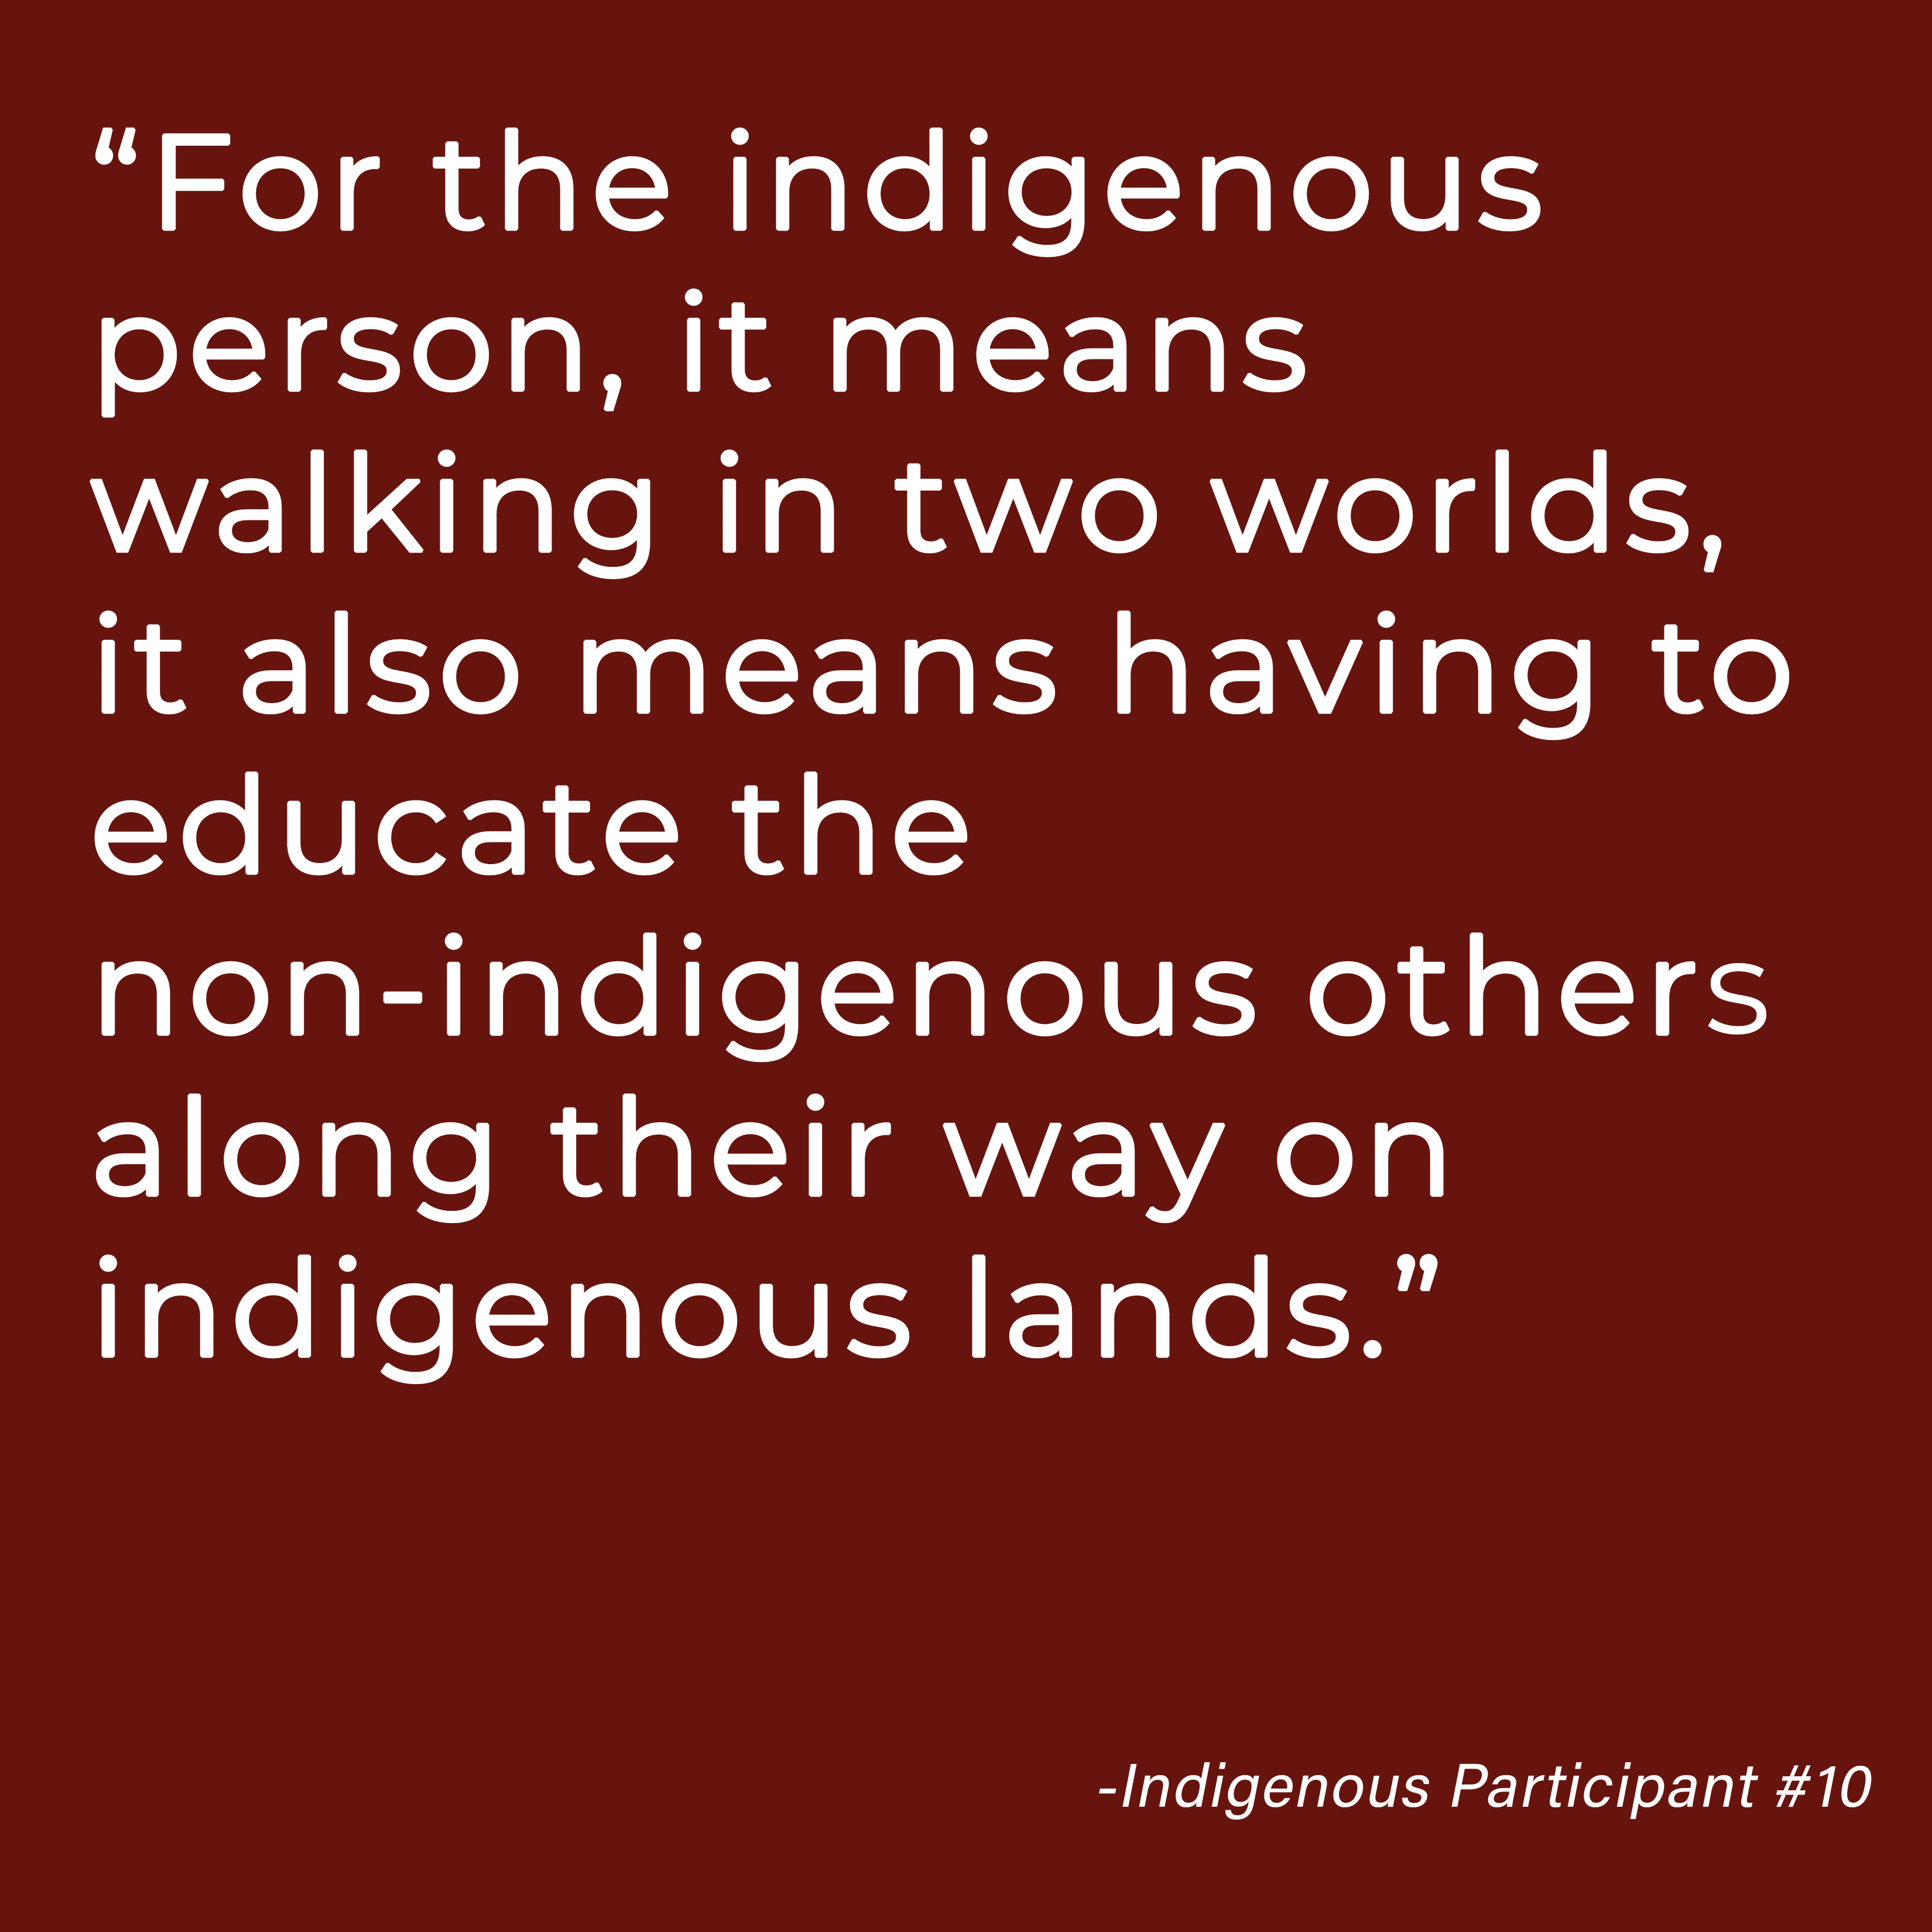
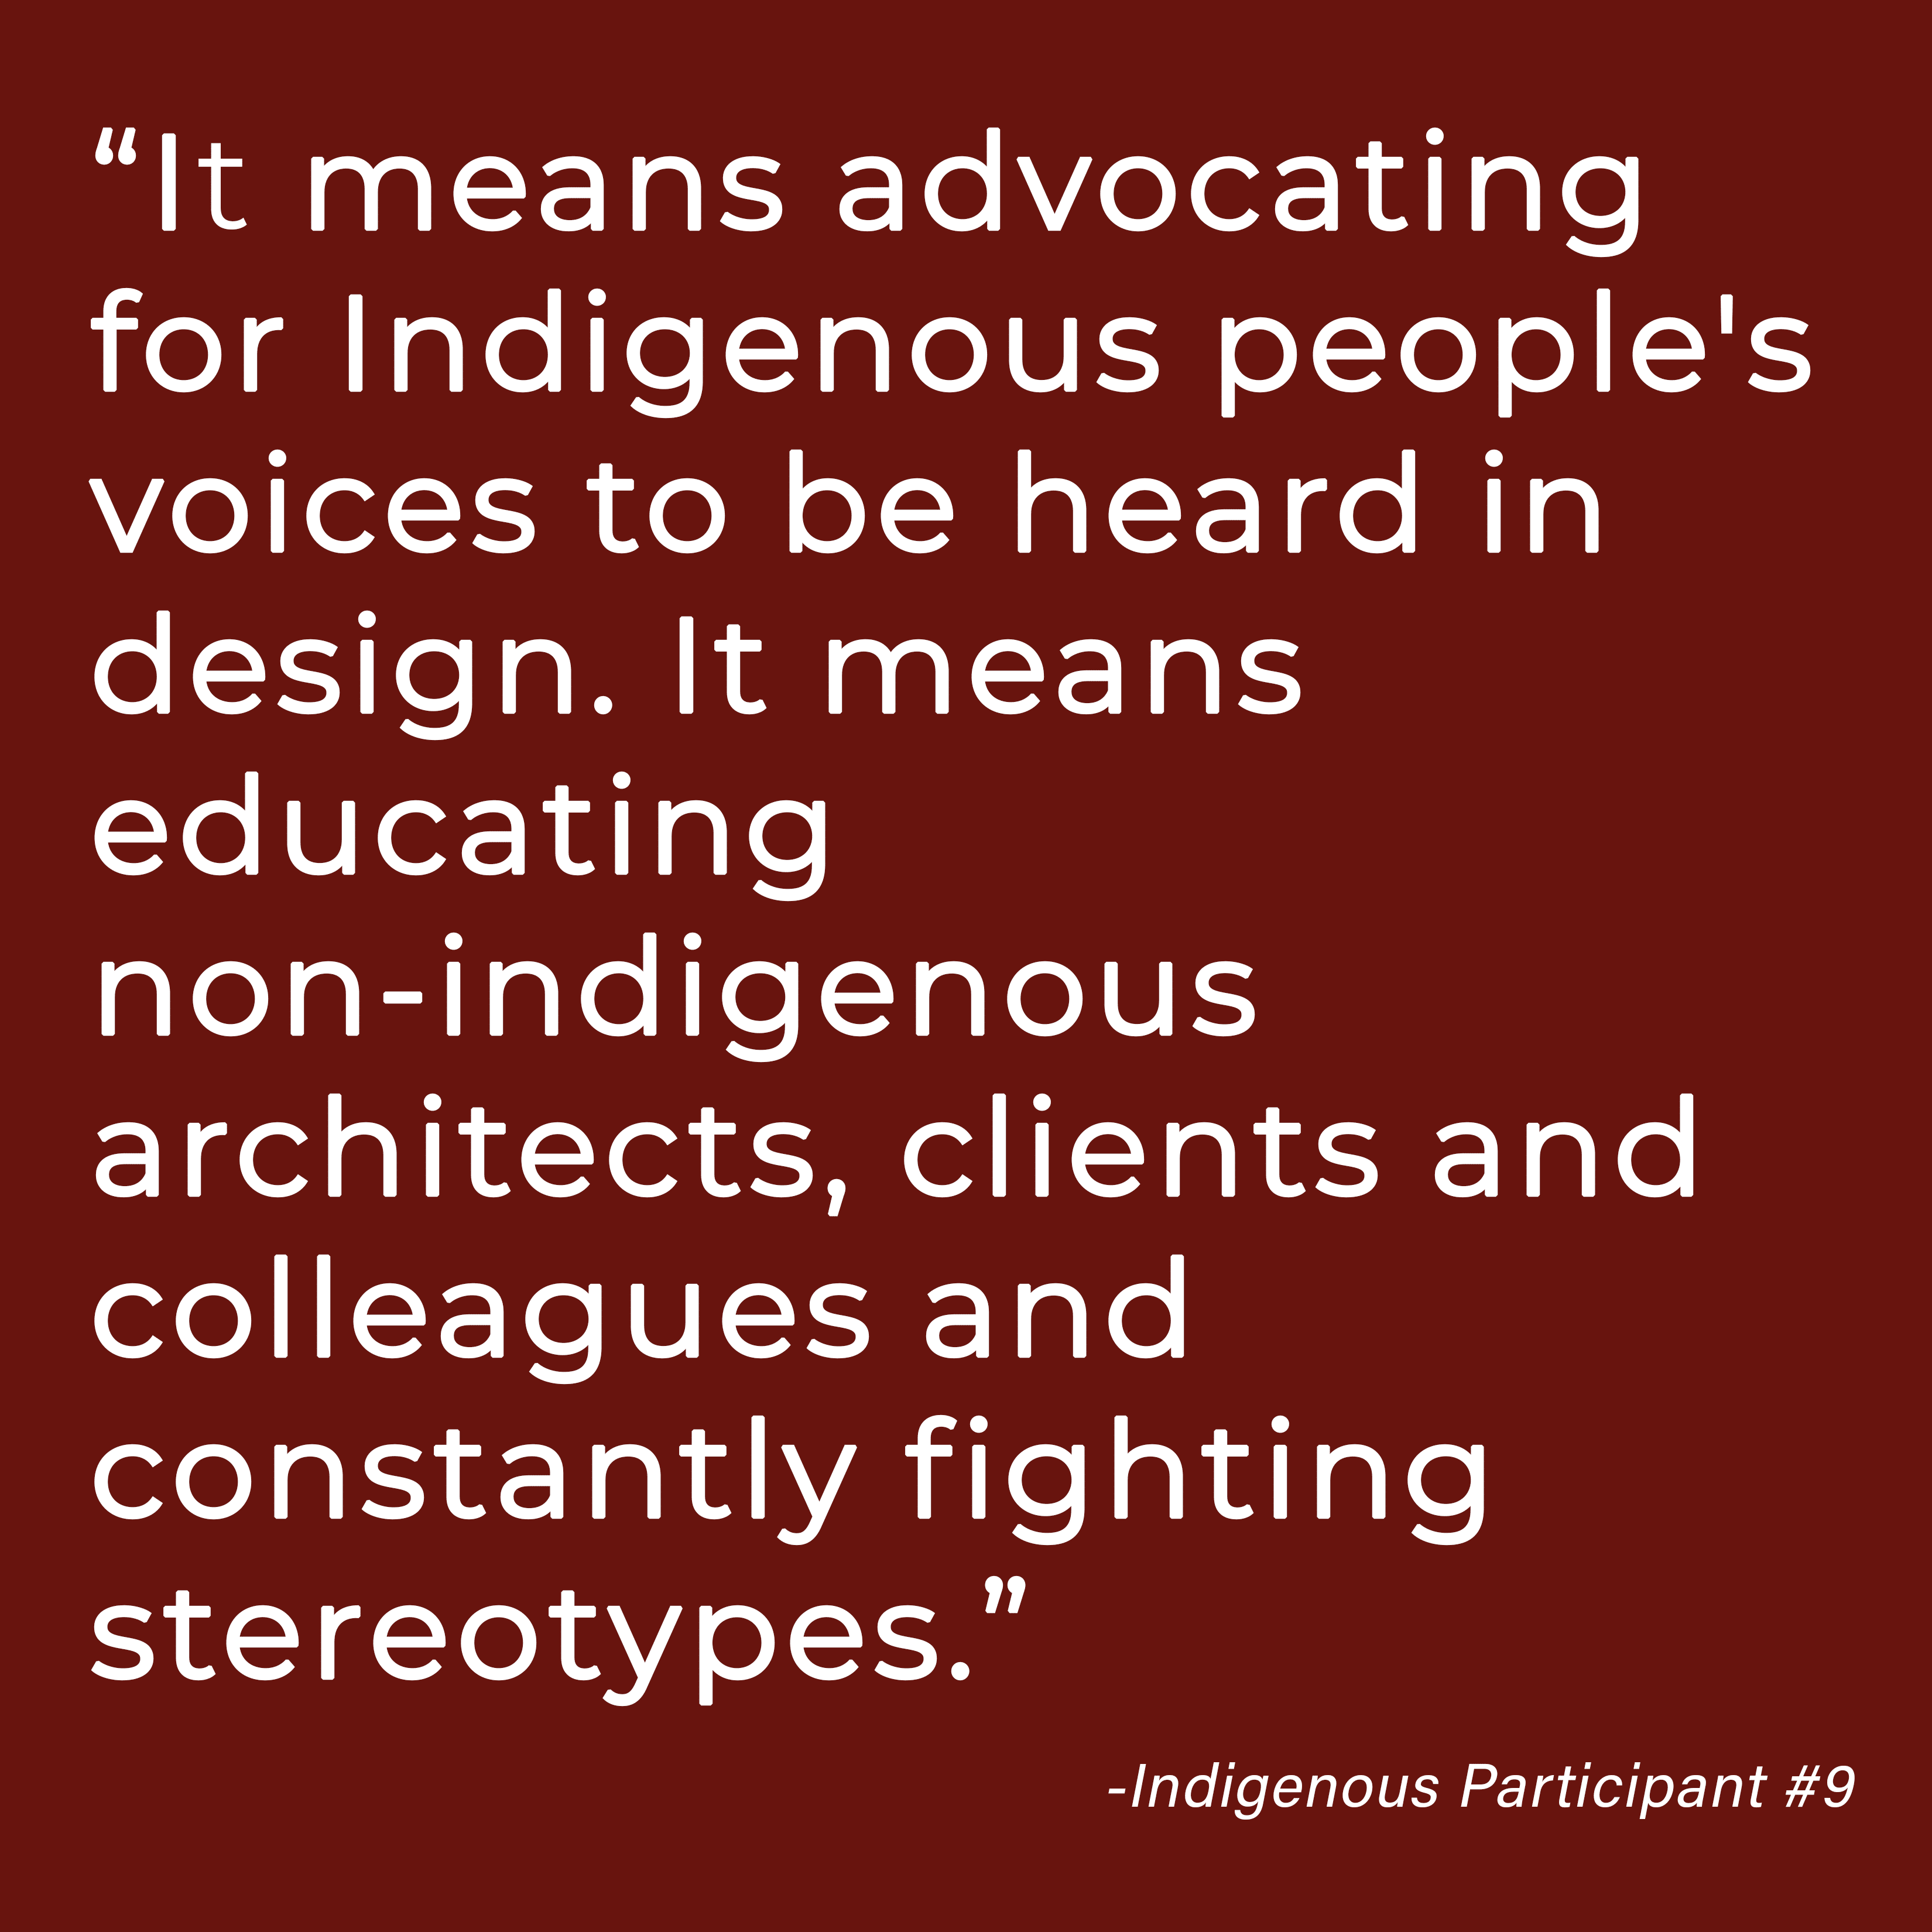
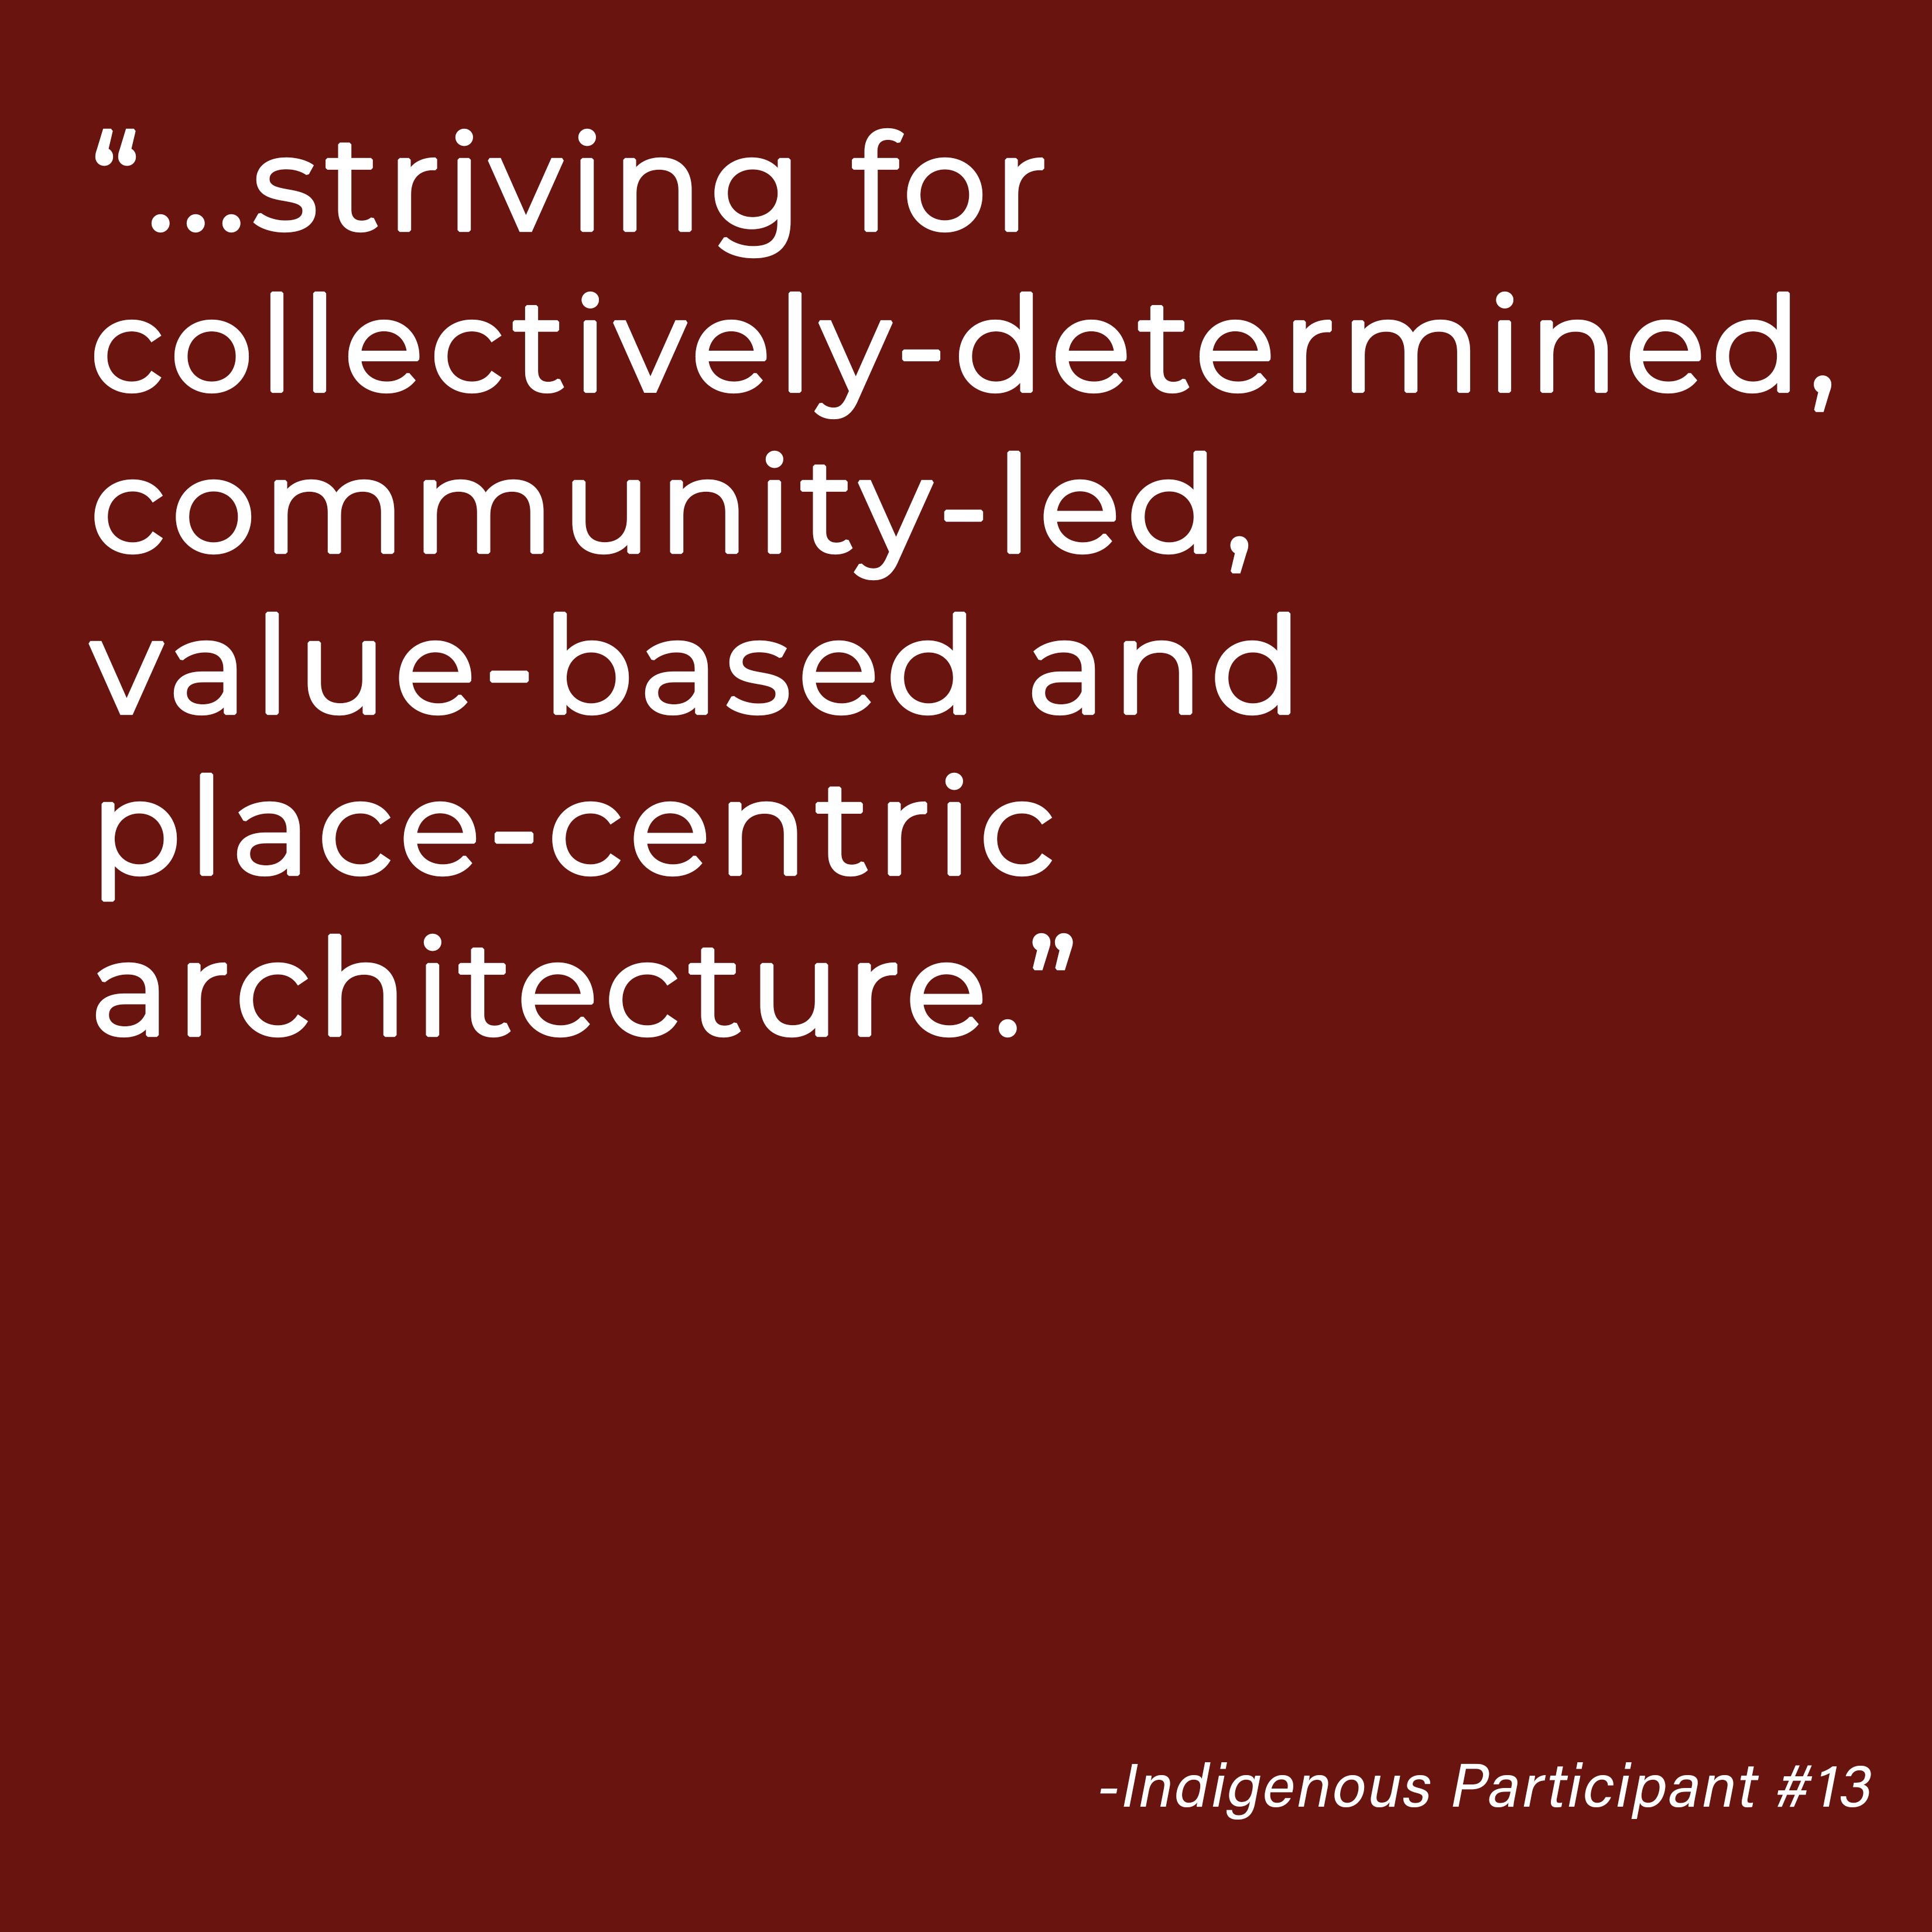
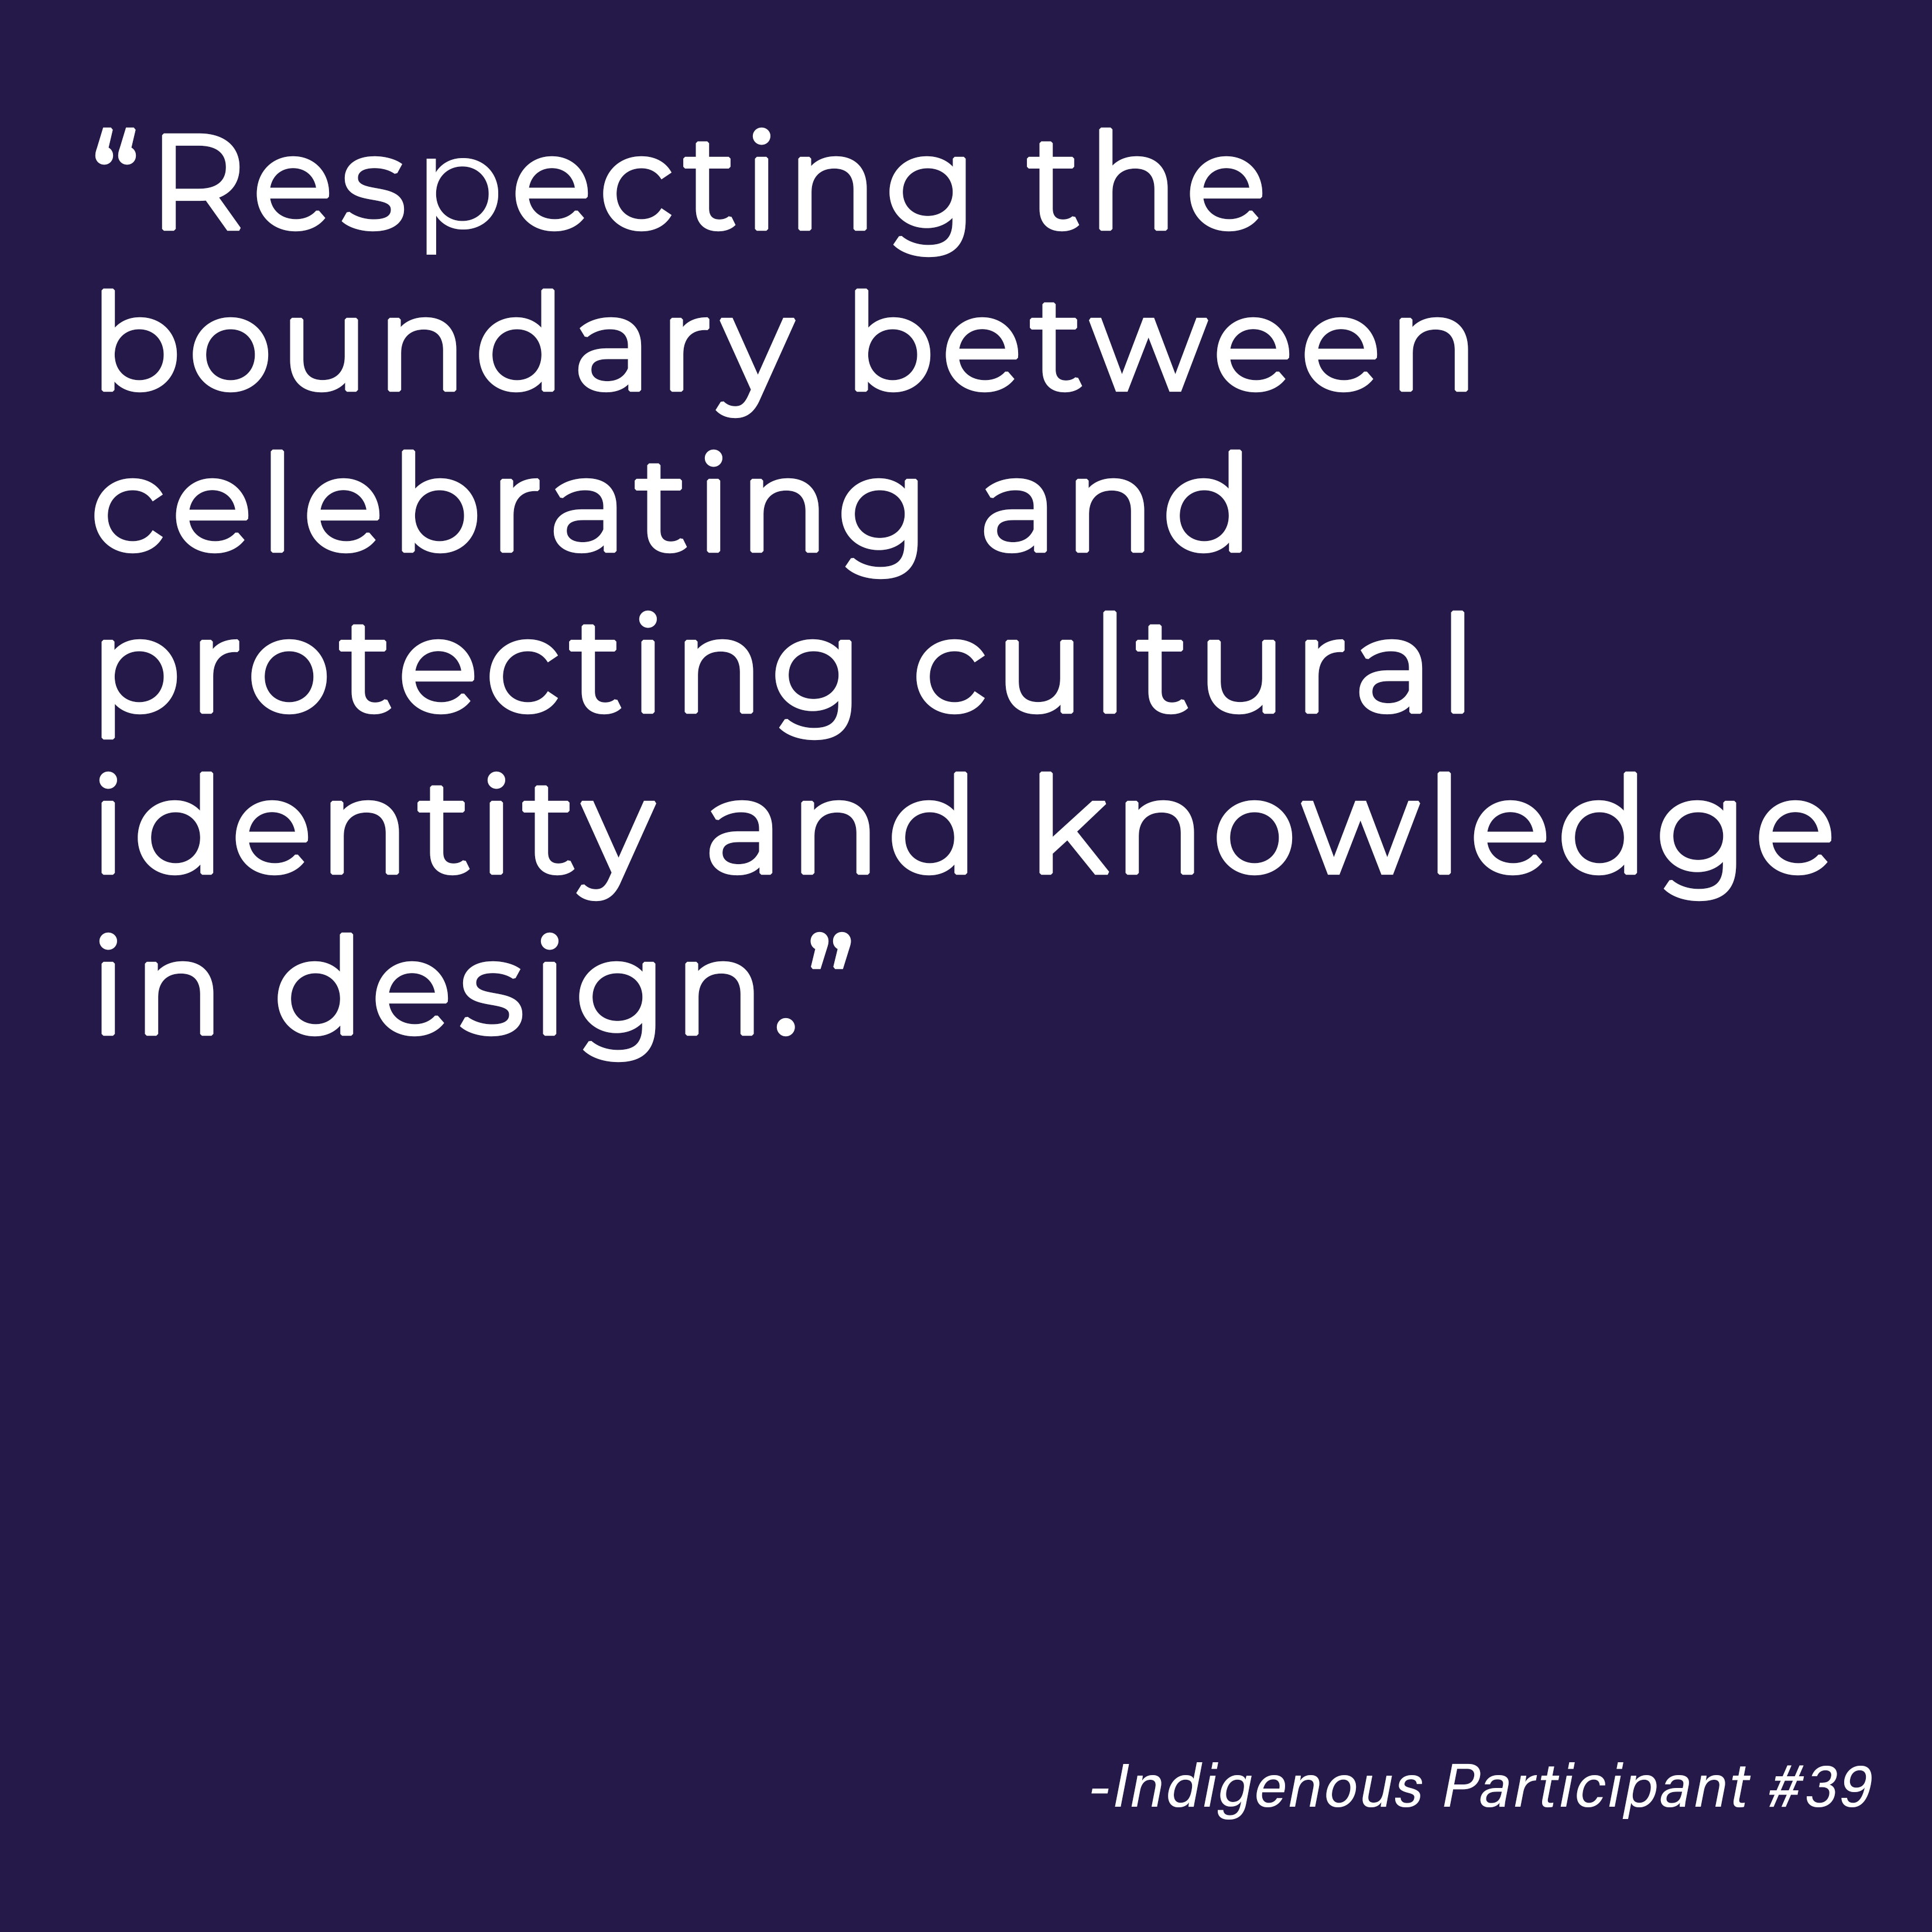
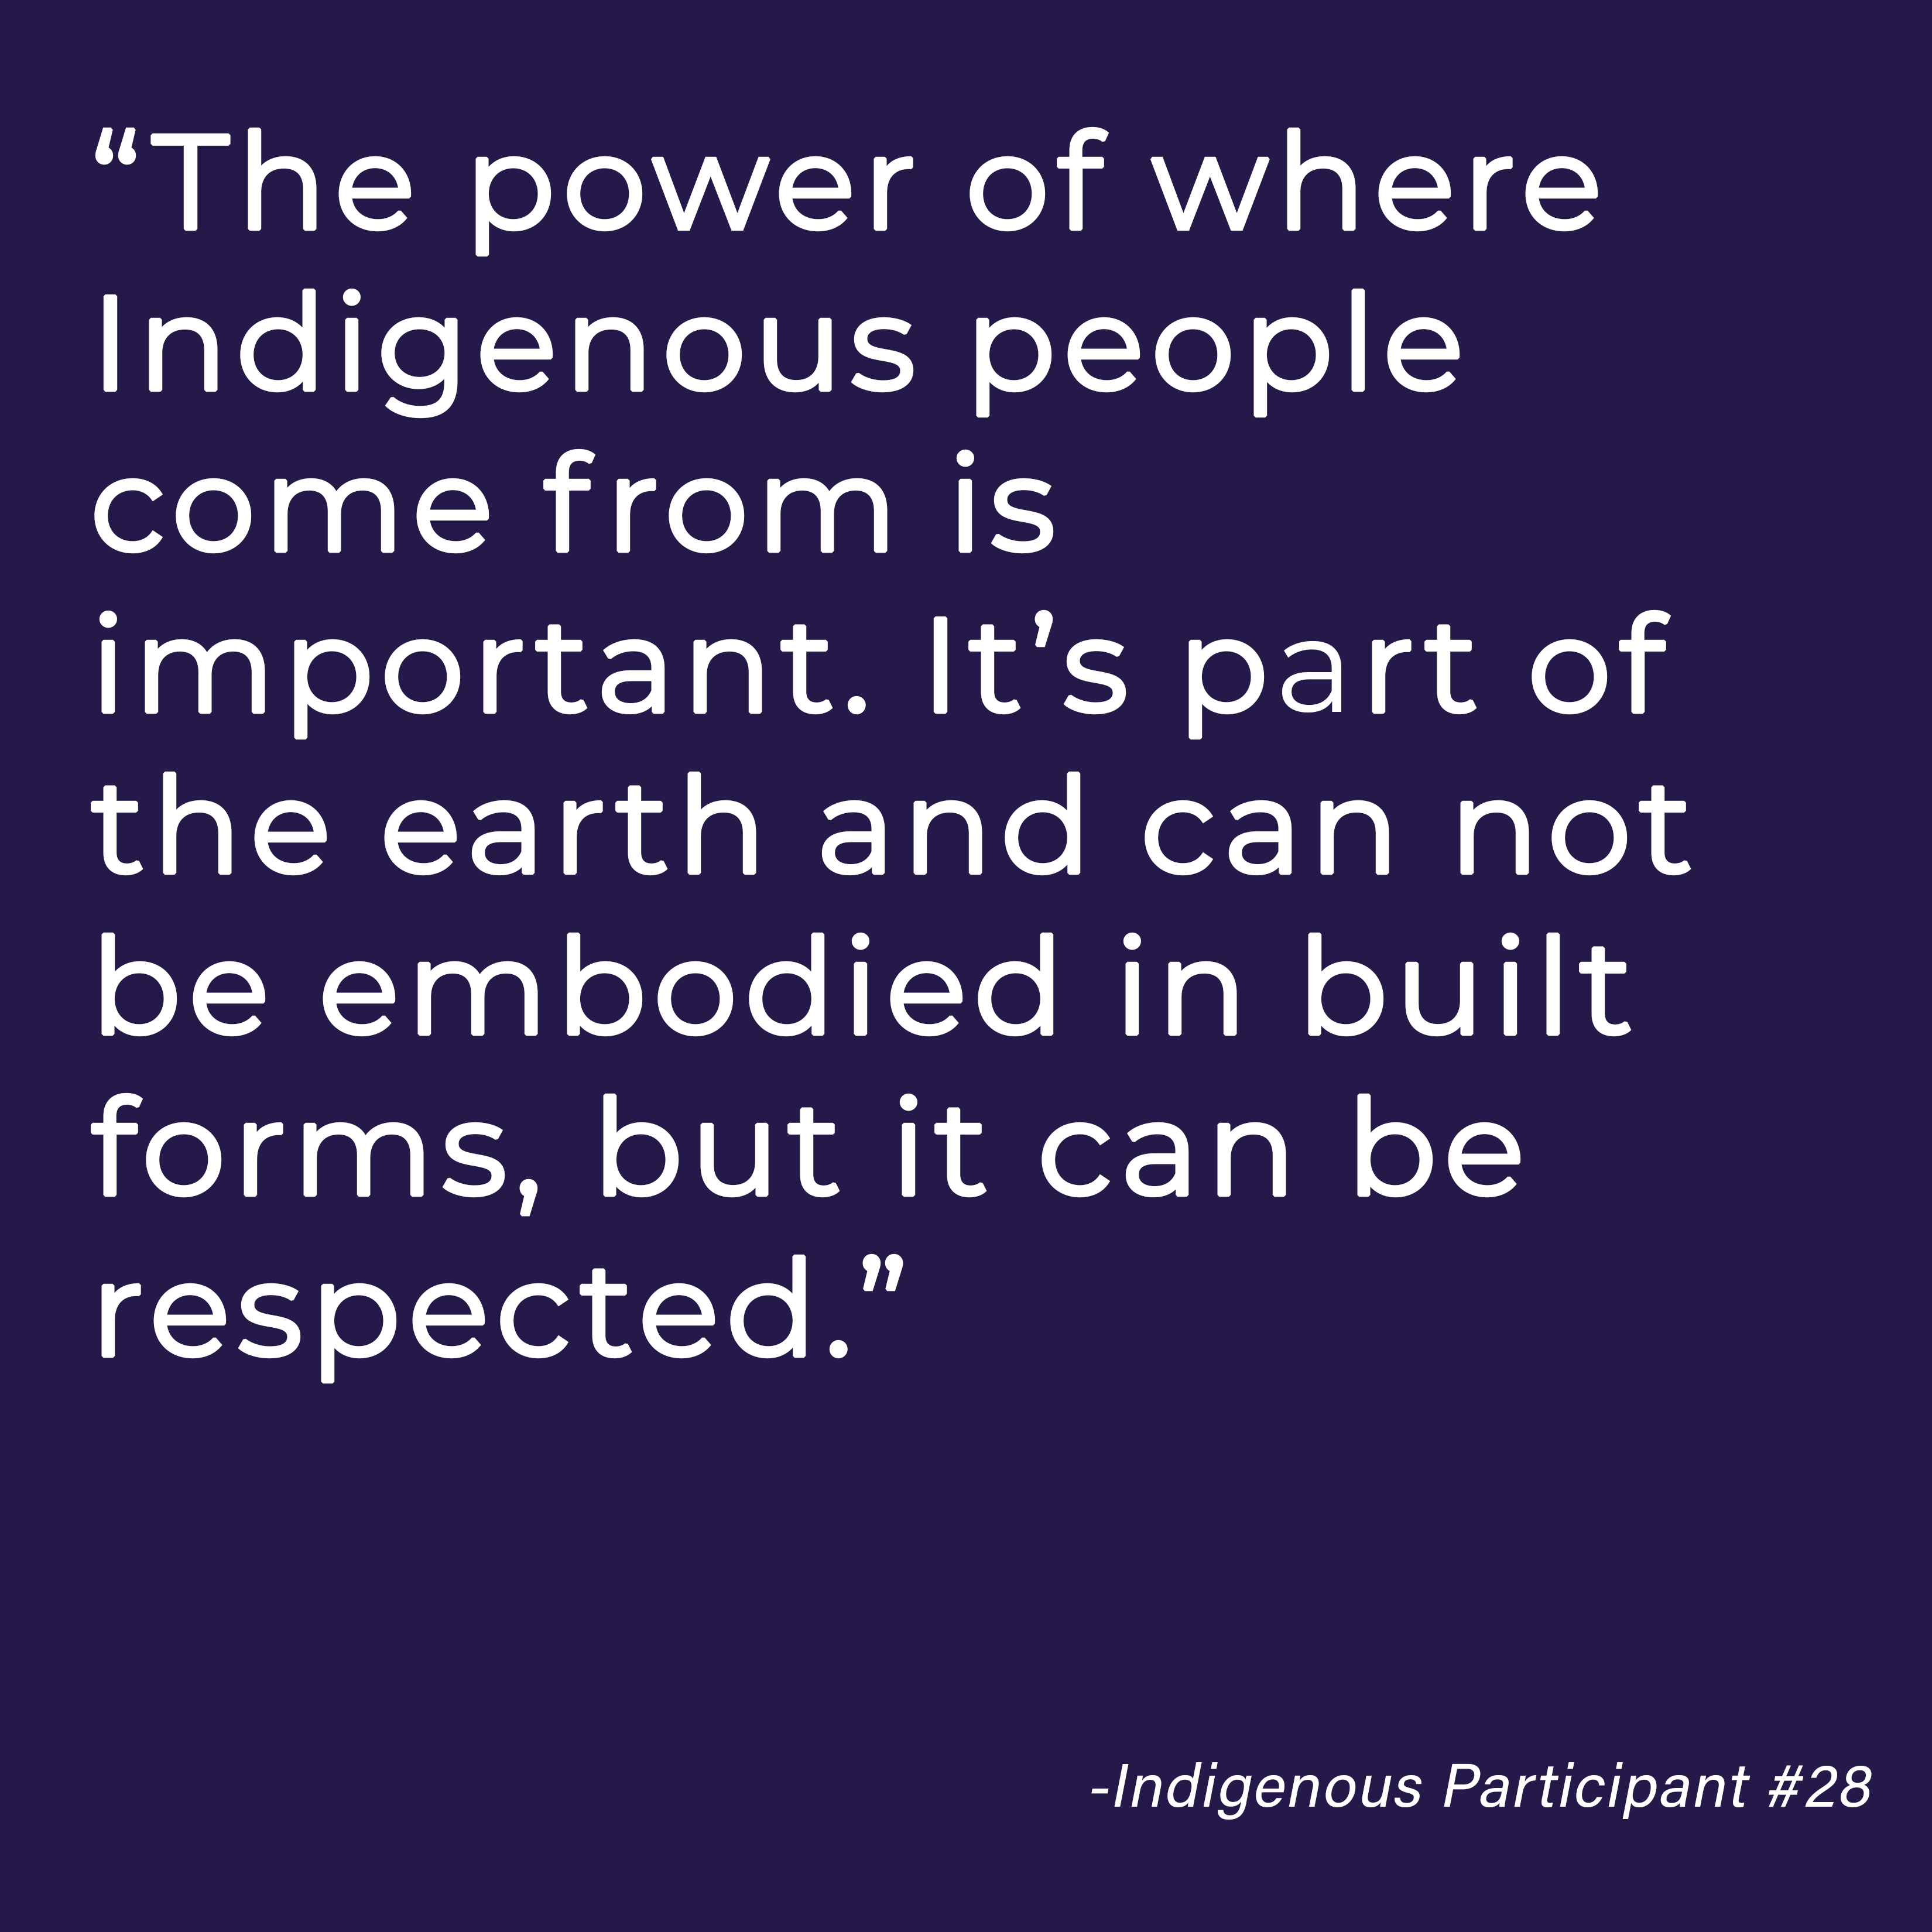
When we asked survey participants what it means to be Native or Indigenous in architecture many noted the scarcity of Indigenous designers as provoking feelings of being alone. Even when the larger group of Indigenous designers was noted to have a close bond, participants still shared the feeling of being an outsider. However, by and large, the most significant theme that emerged was the responsibility to be a cultural protector or guardian. Sometimes this manifested as pride and expertise, and other times it manifested out of concern for the earth and the land. The latter was most usually tied to a need to communicate the importance of Native traditions and environmental stewardship to architecture at large.
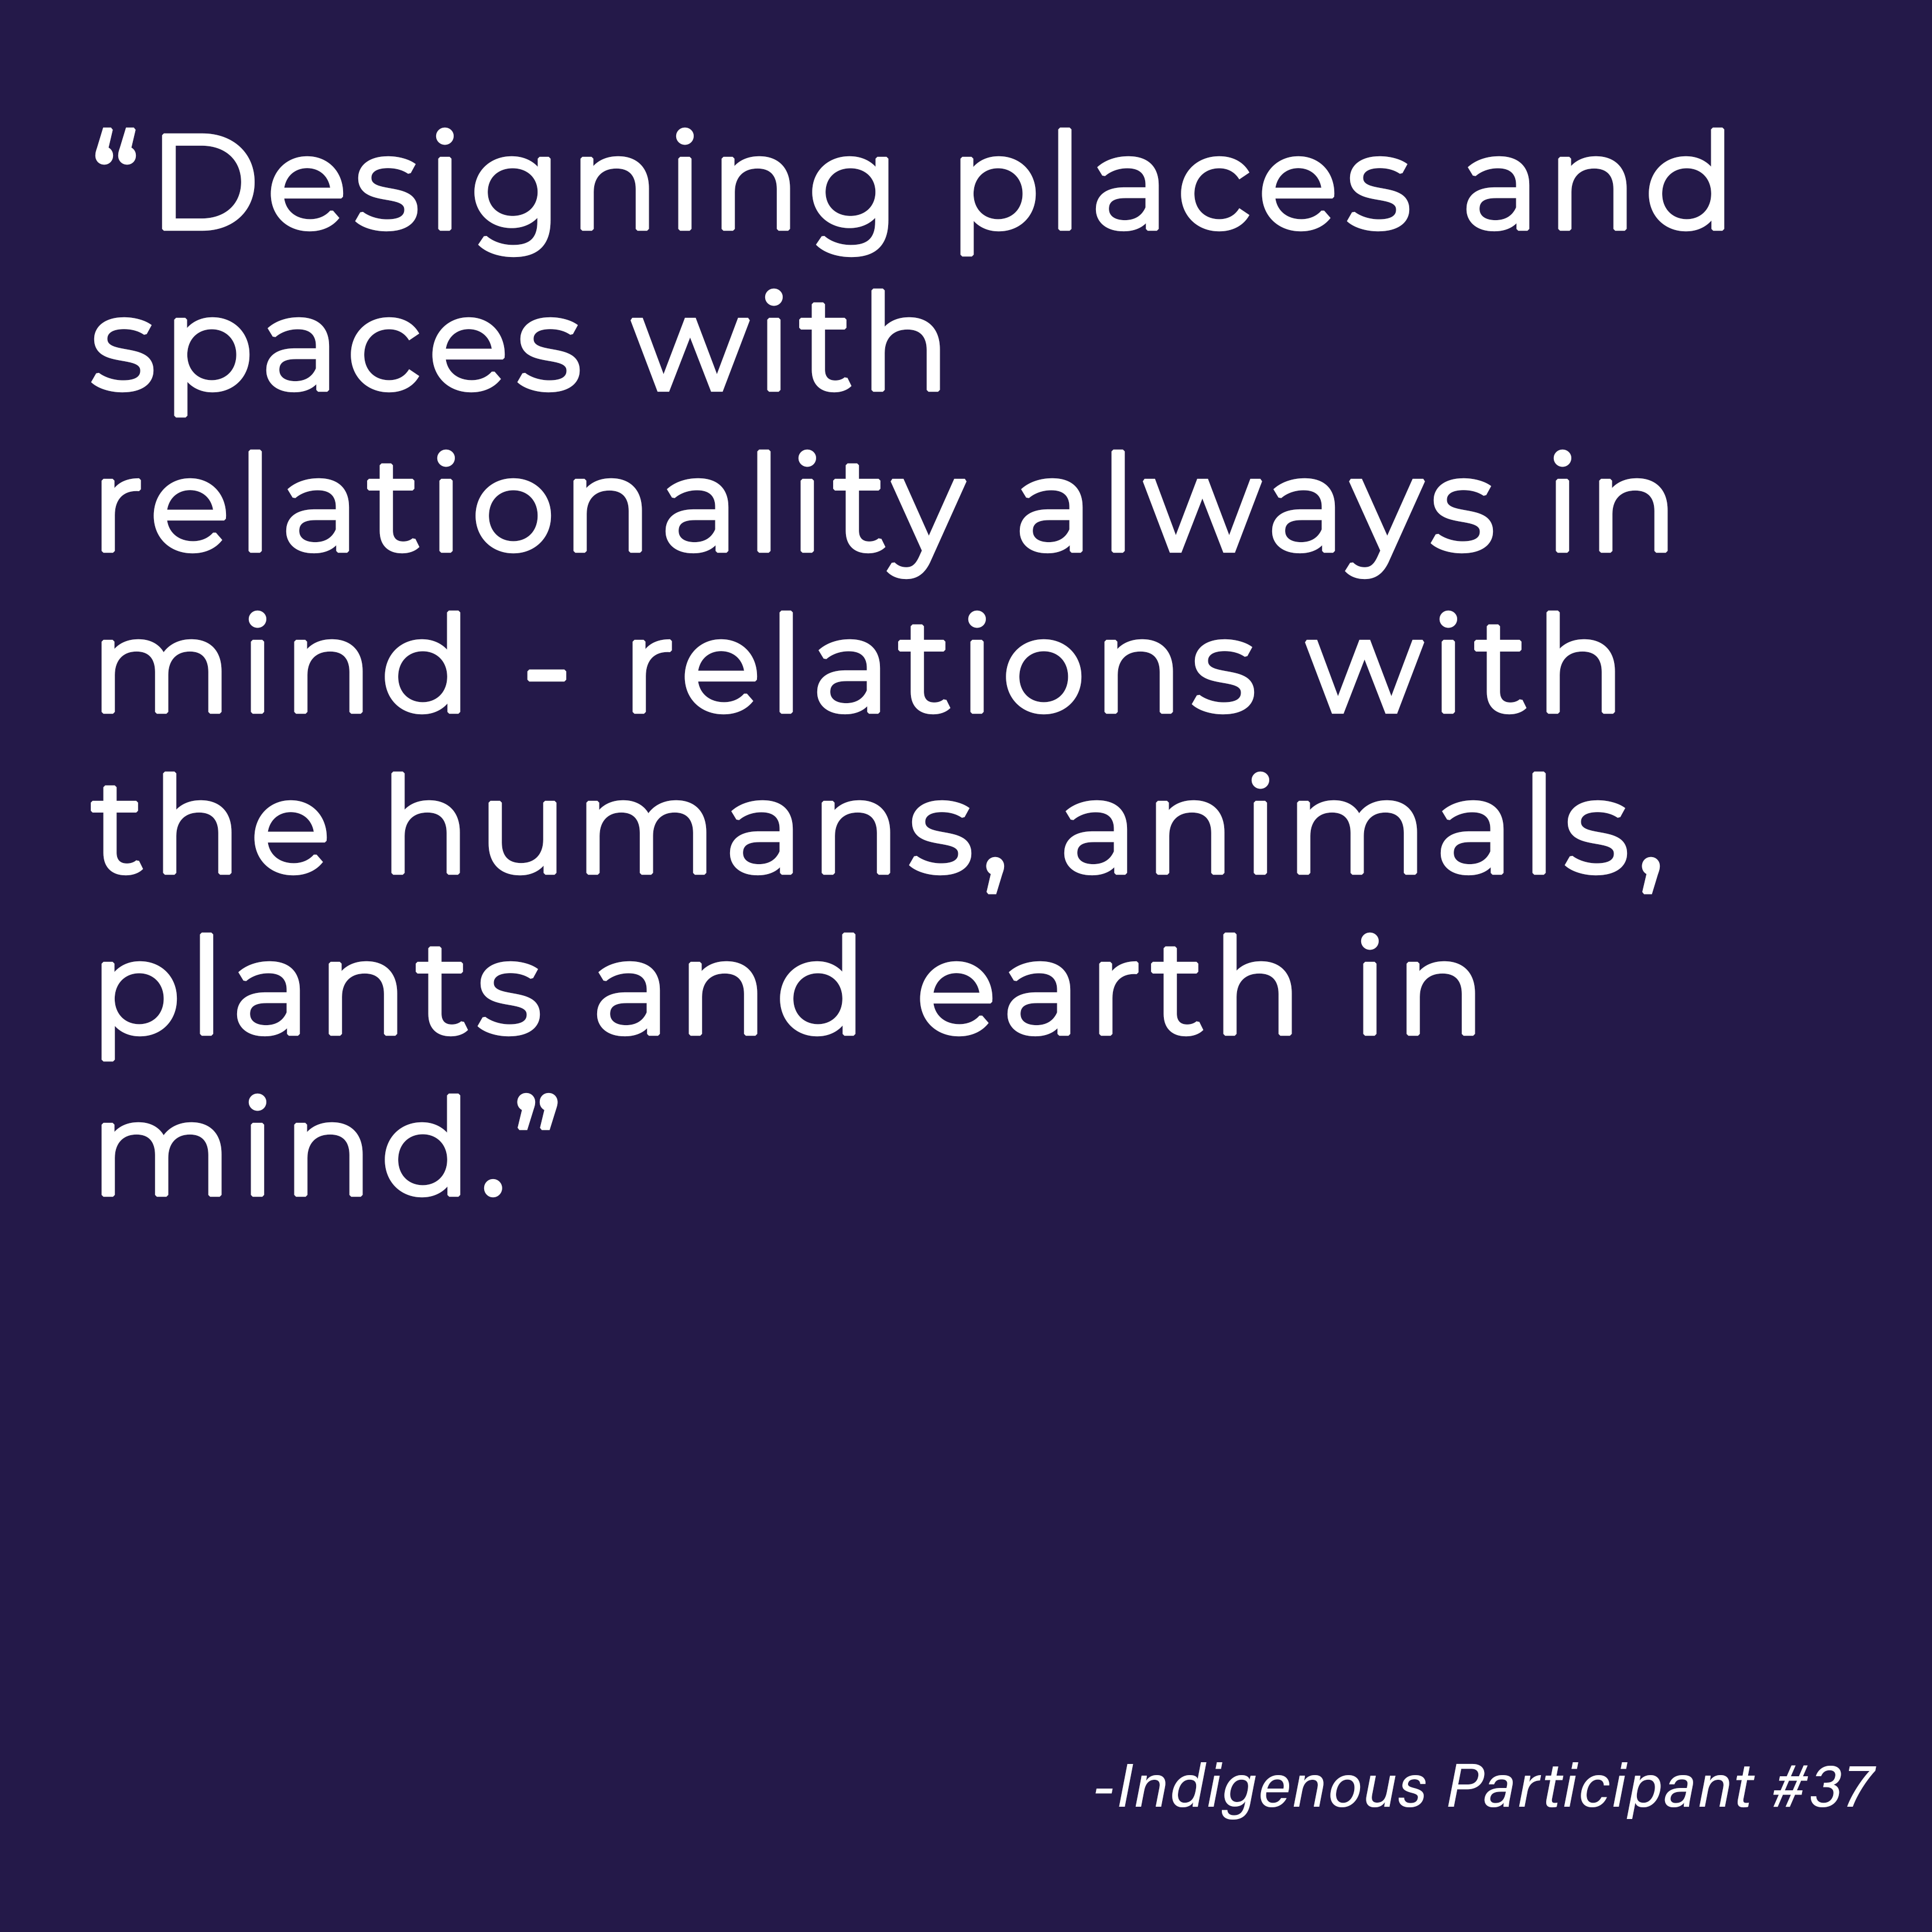
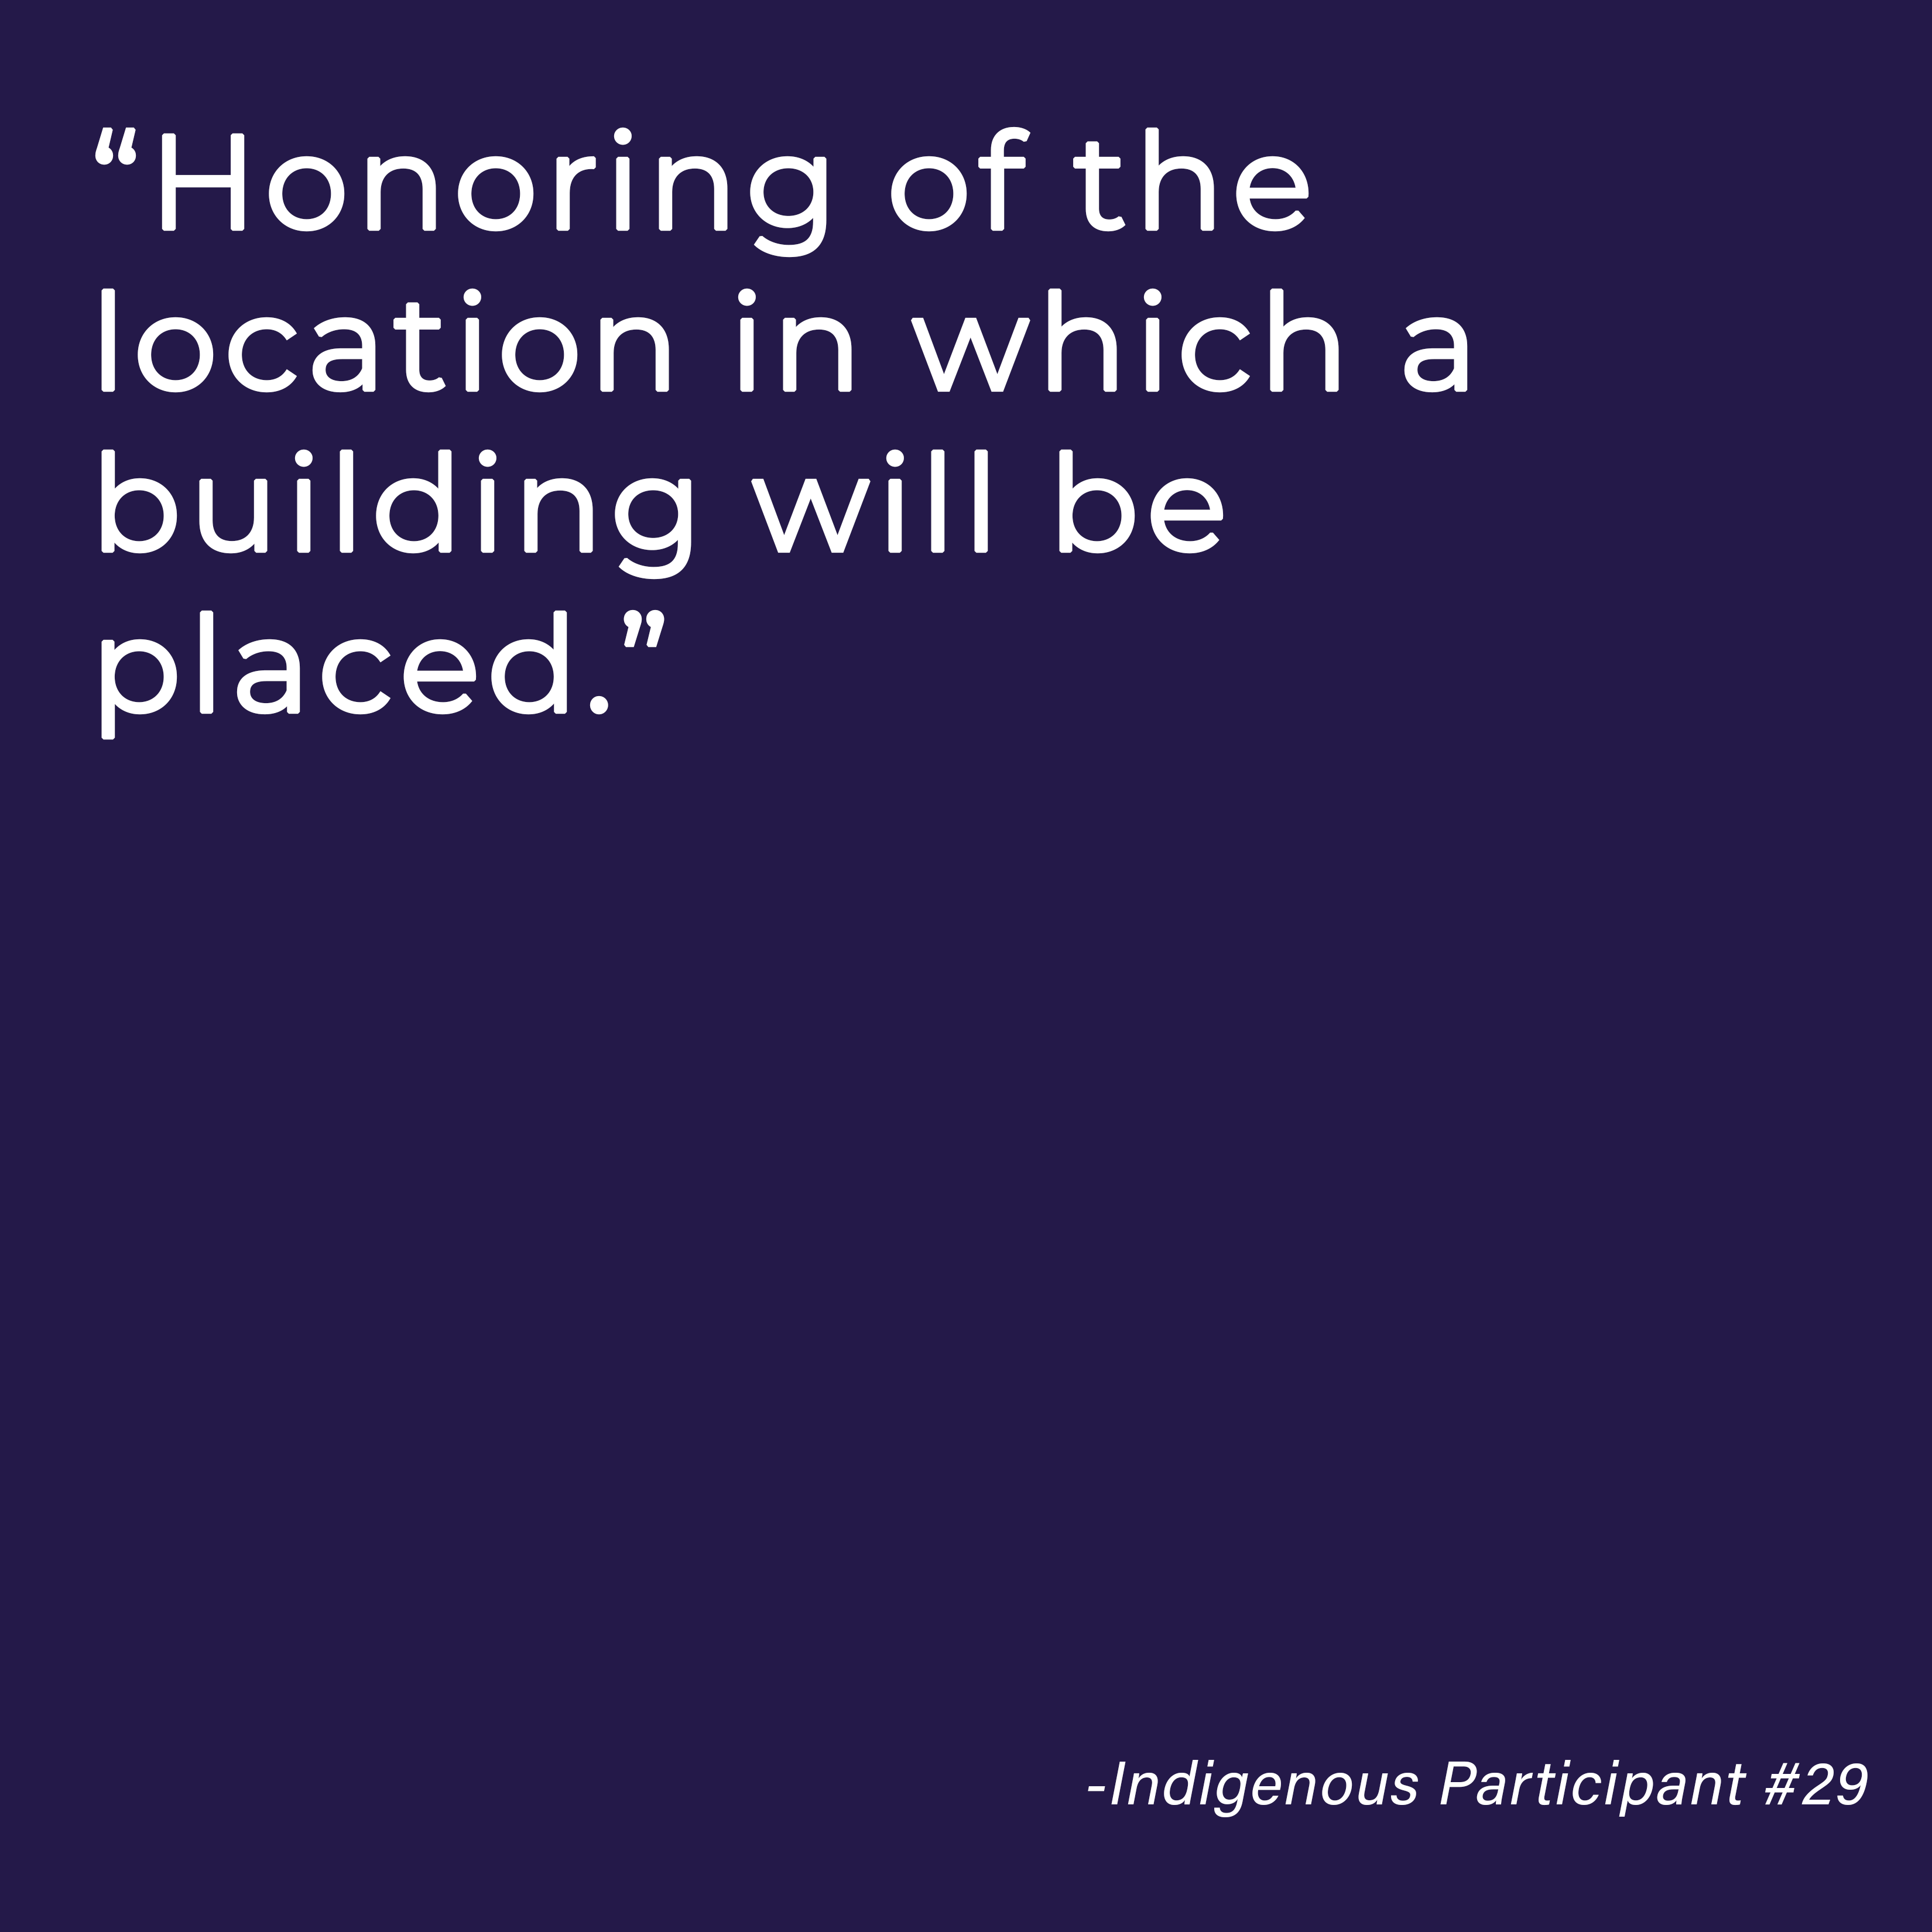
When we asked participants about an area or issue that was important but often devalued across the discipline, respondents overwhelmingly cited ‘relationship’ and ‘respect for Indigenous culture’. Responses often highlighted the relationship between built work and the site, or a relationship between people and the natural world. The cultural ethos of care for the earth was a theme that was found in each open-ended section. Time was another dimension that held significance to some participants. Many noted the work of their ancestors and others noted a look forward to future generations. Though not stated explicitly, responses seem to imbue a distinct difference in the process of design carried out by Indigenous peoples that is centers on commonly practiced beliefs.
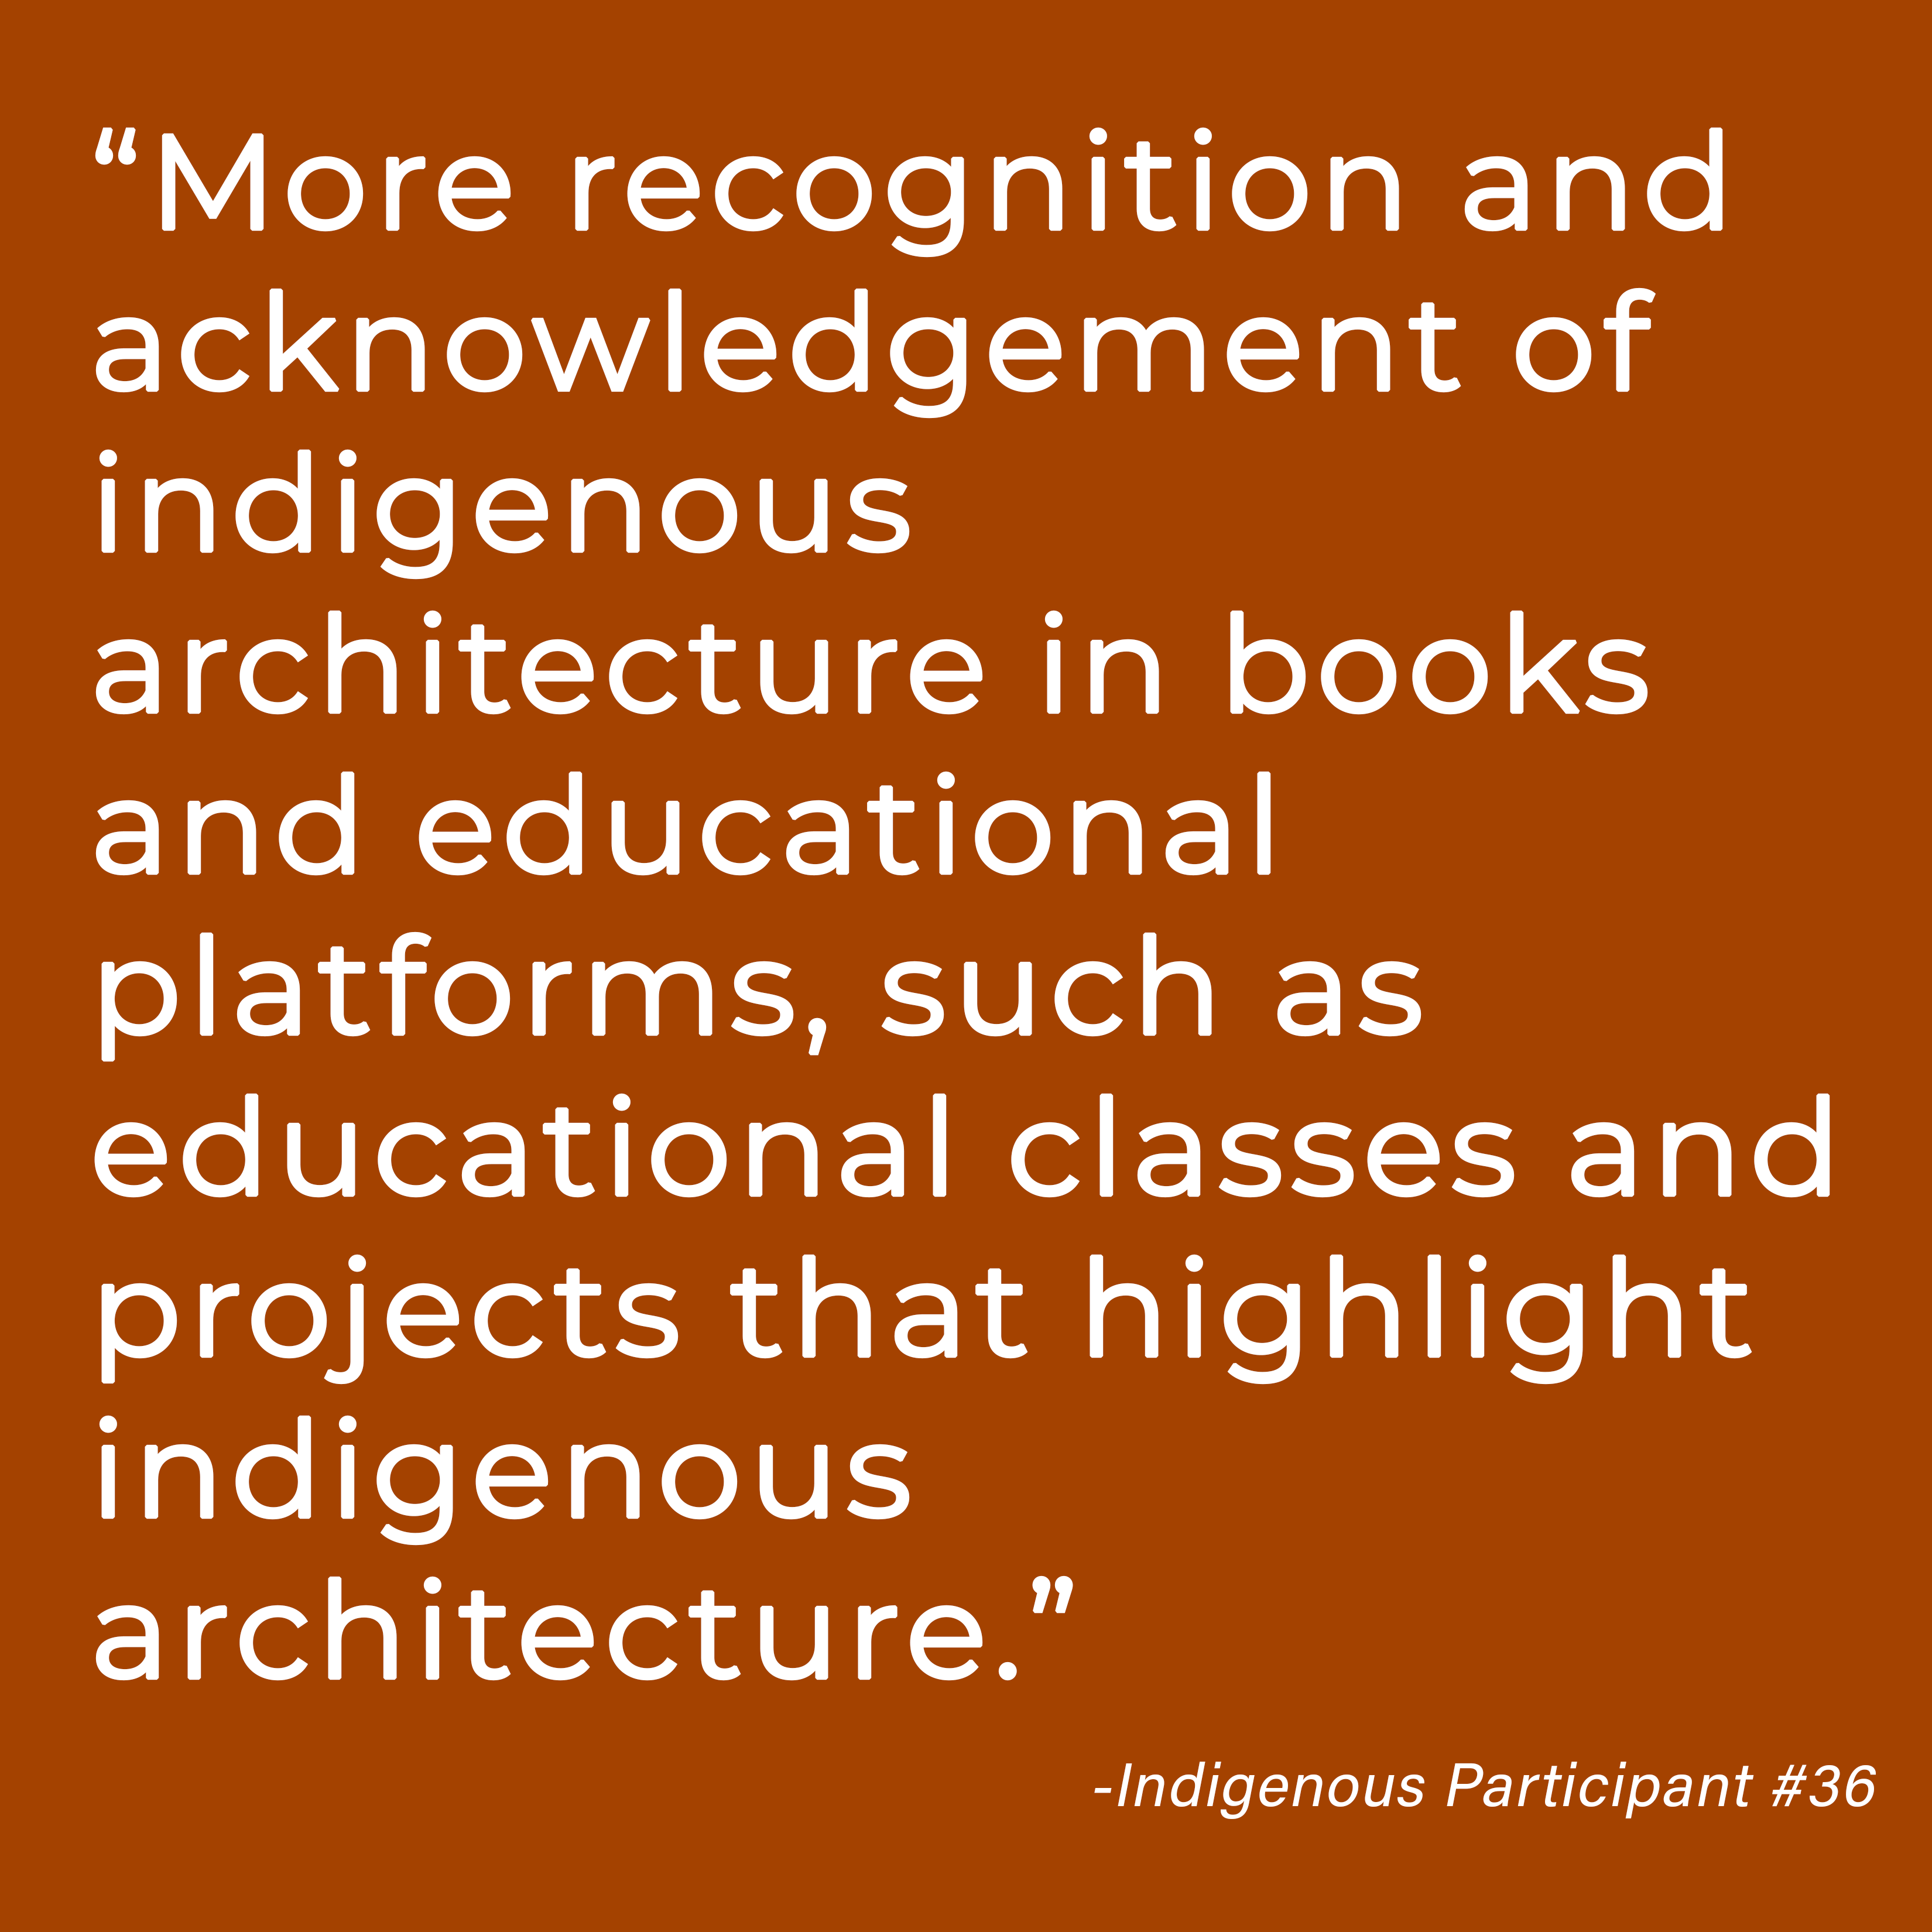
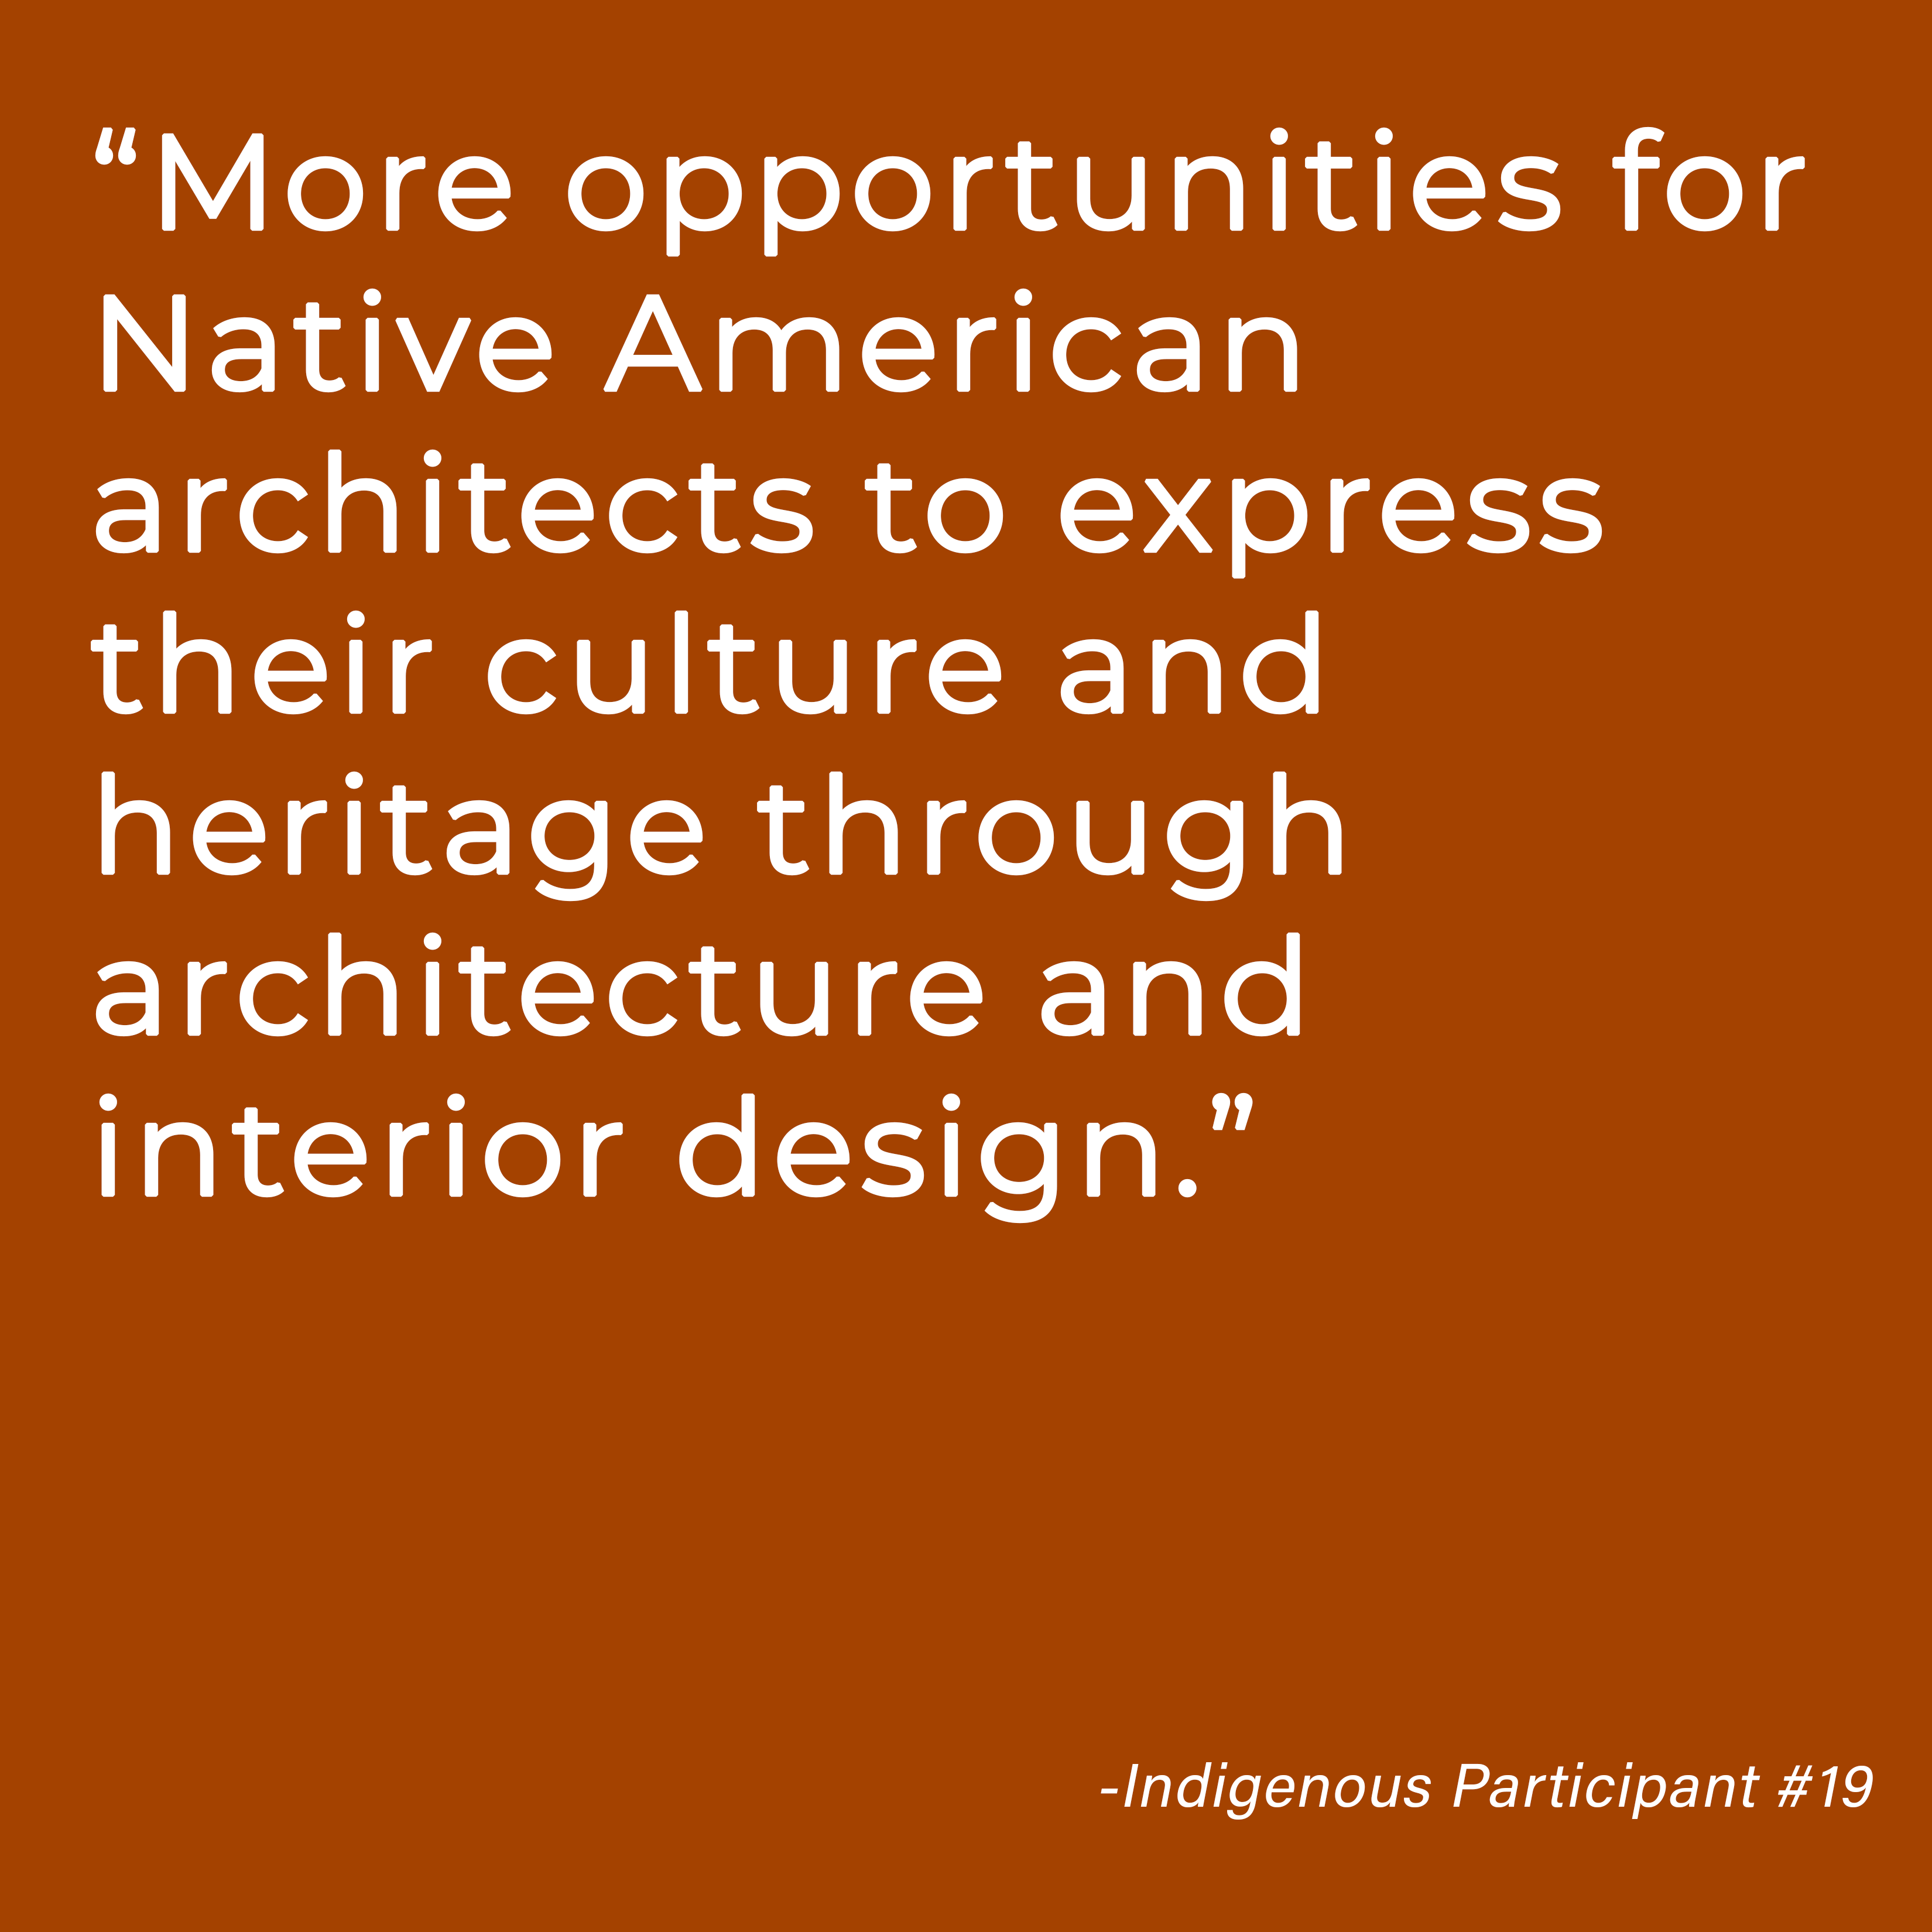
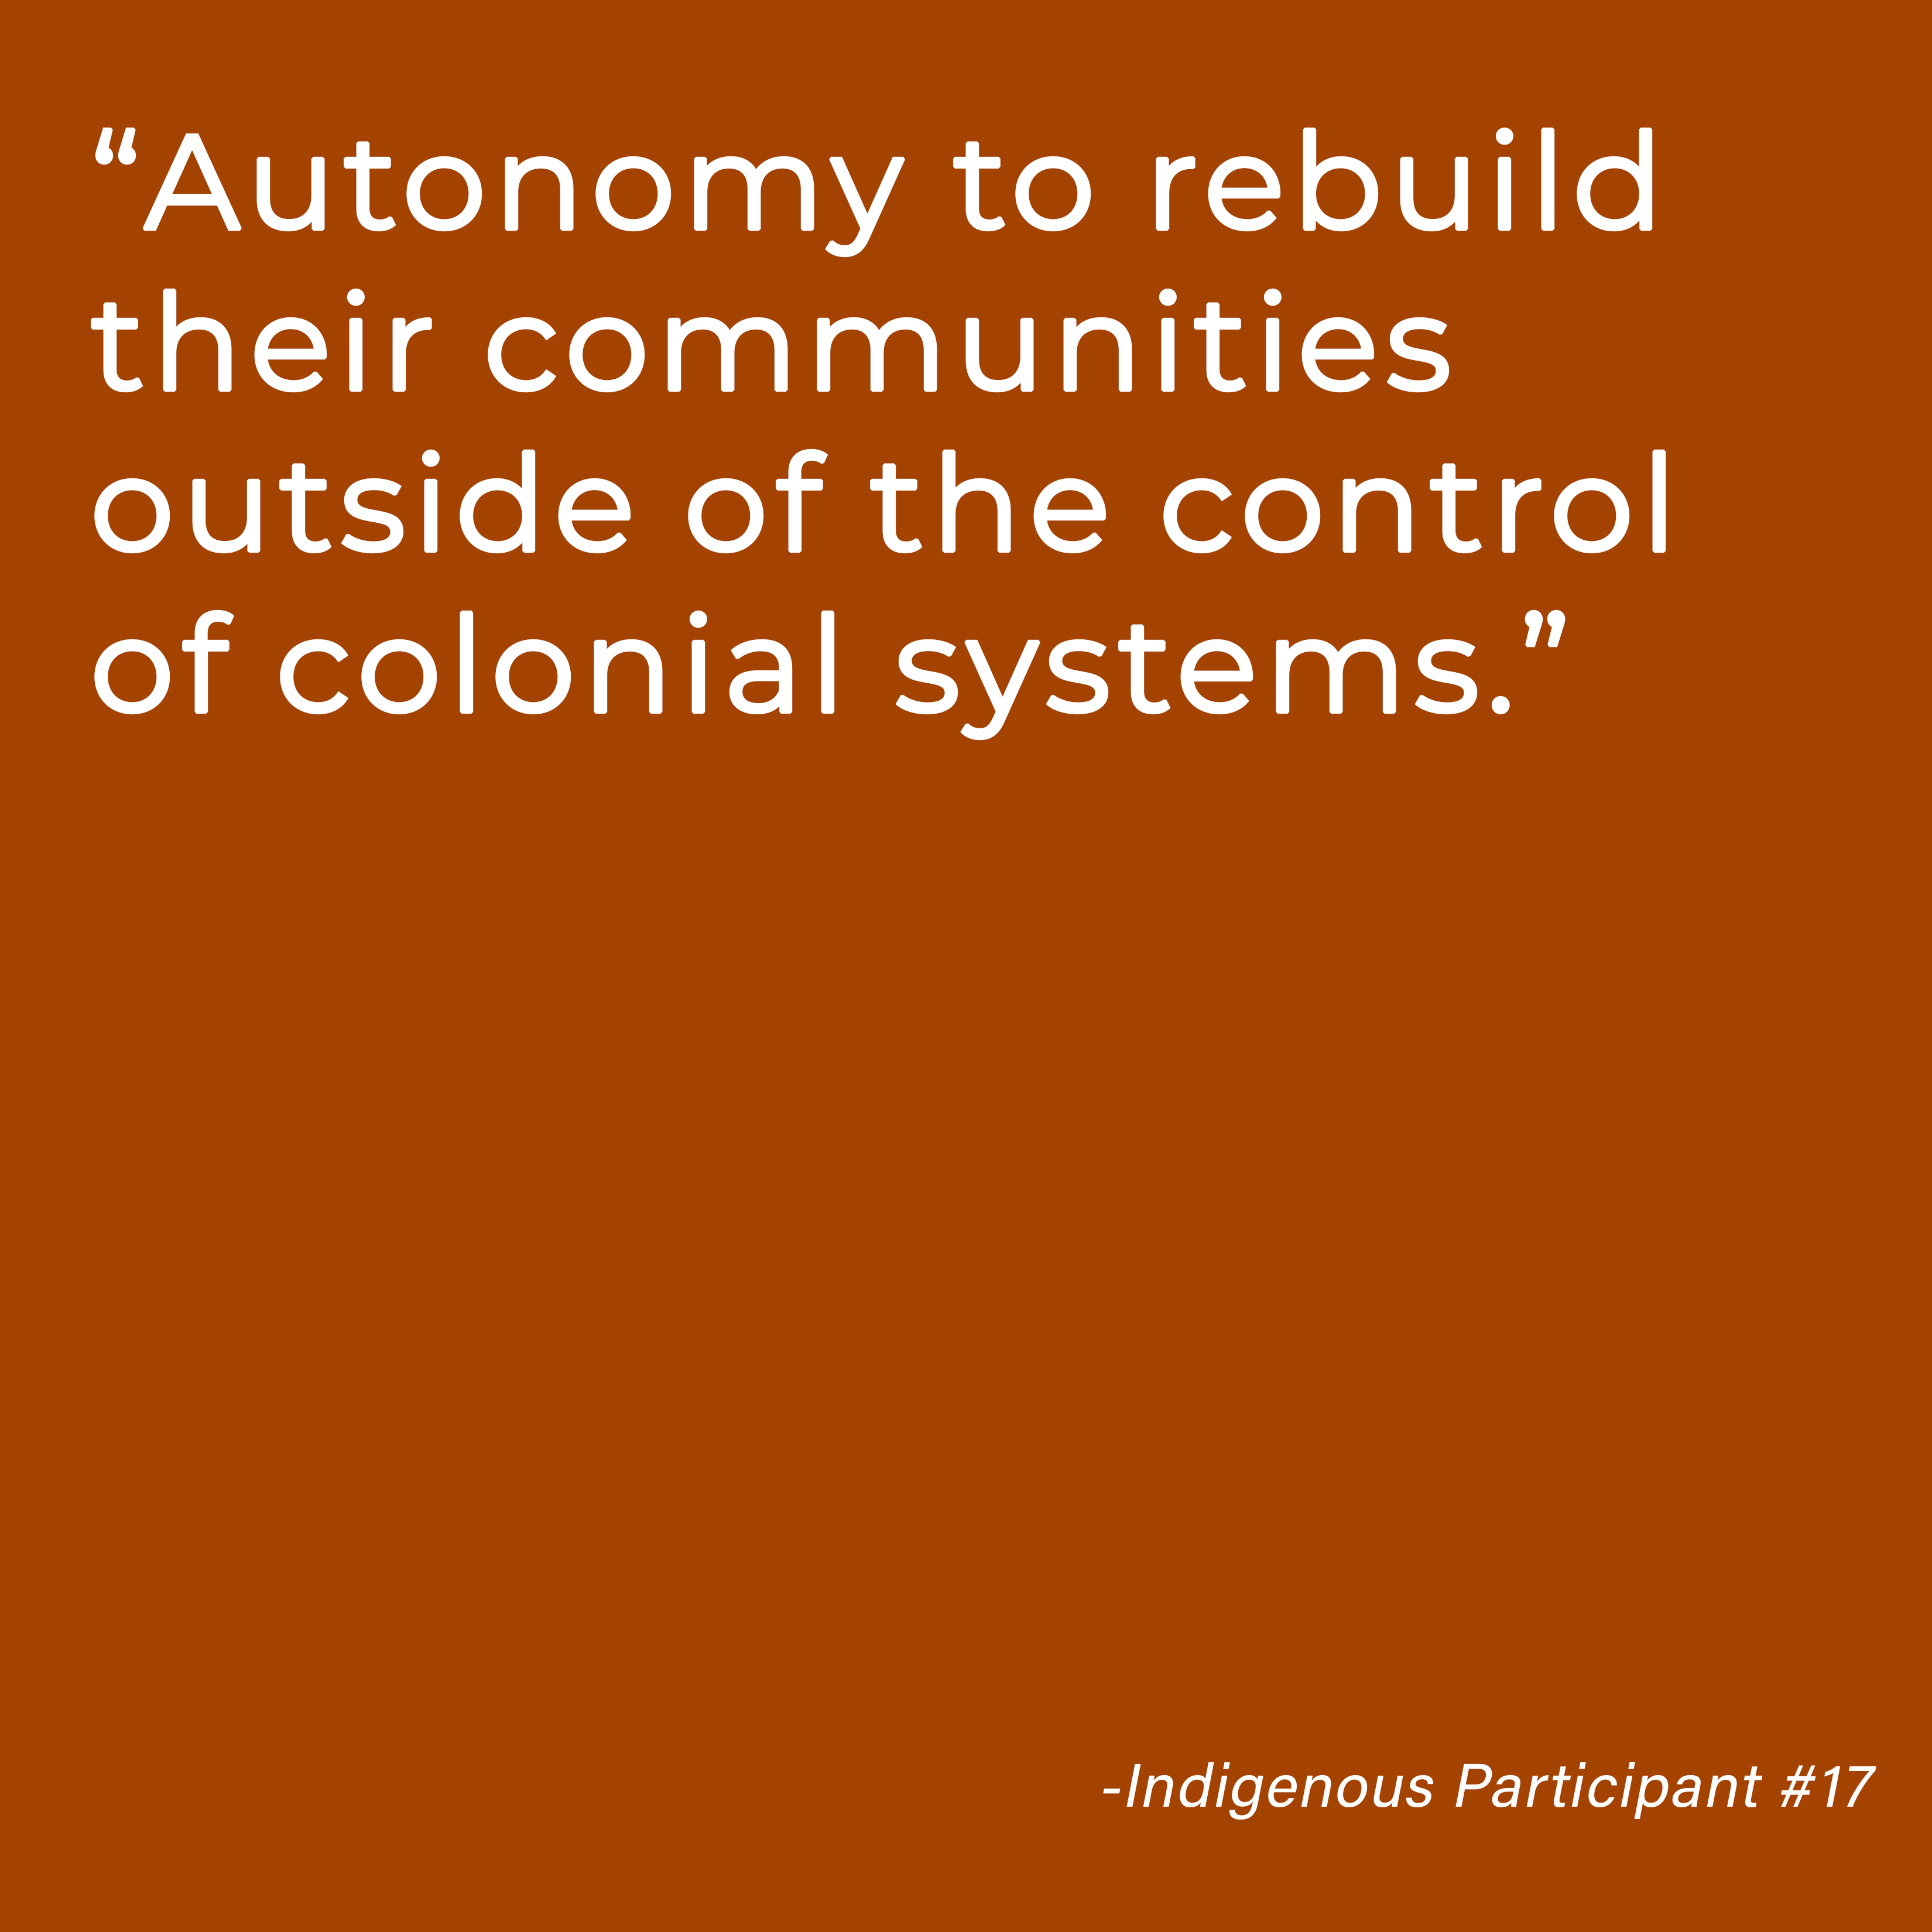
Lastly, we asked survey participants about something the discipline can give to Indigenous peoples and responses largely circled around three themes: ‘recognition,’ ‘opportunity,’ and ‘autonomy.’ The first theme, ‘recognition,’ appeared as a way to give voice to Indigenous designers. The sentiment of a devalued expertise reappeared in responses that centered around inclusion and design. The second theme, ‘opportunity,’ manifested as a request for access and resources. Participants noted the grave disparity between Indigenous communities and non-Indigenous communities to basic needs like food, shelter and water for some tribes. The third and final theme, ‘autonomy,’ is a title that includes all of the comments for jurisdiction, sovereignty, freedom, and the reduction of Western interference.
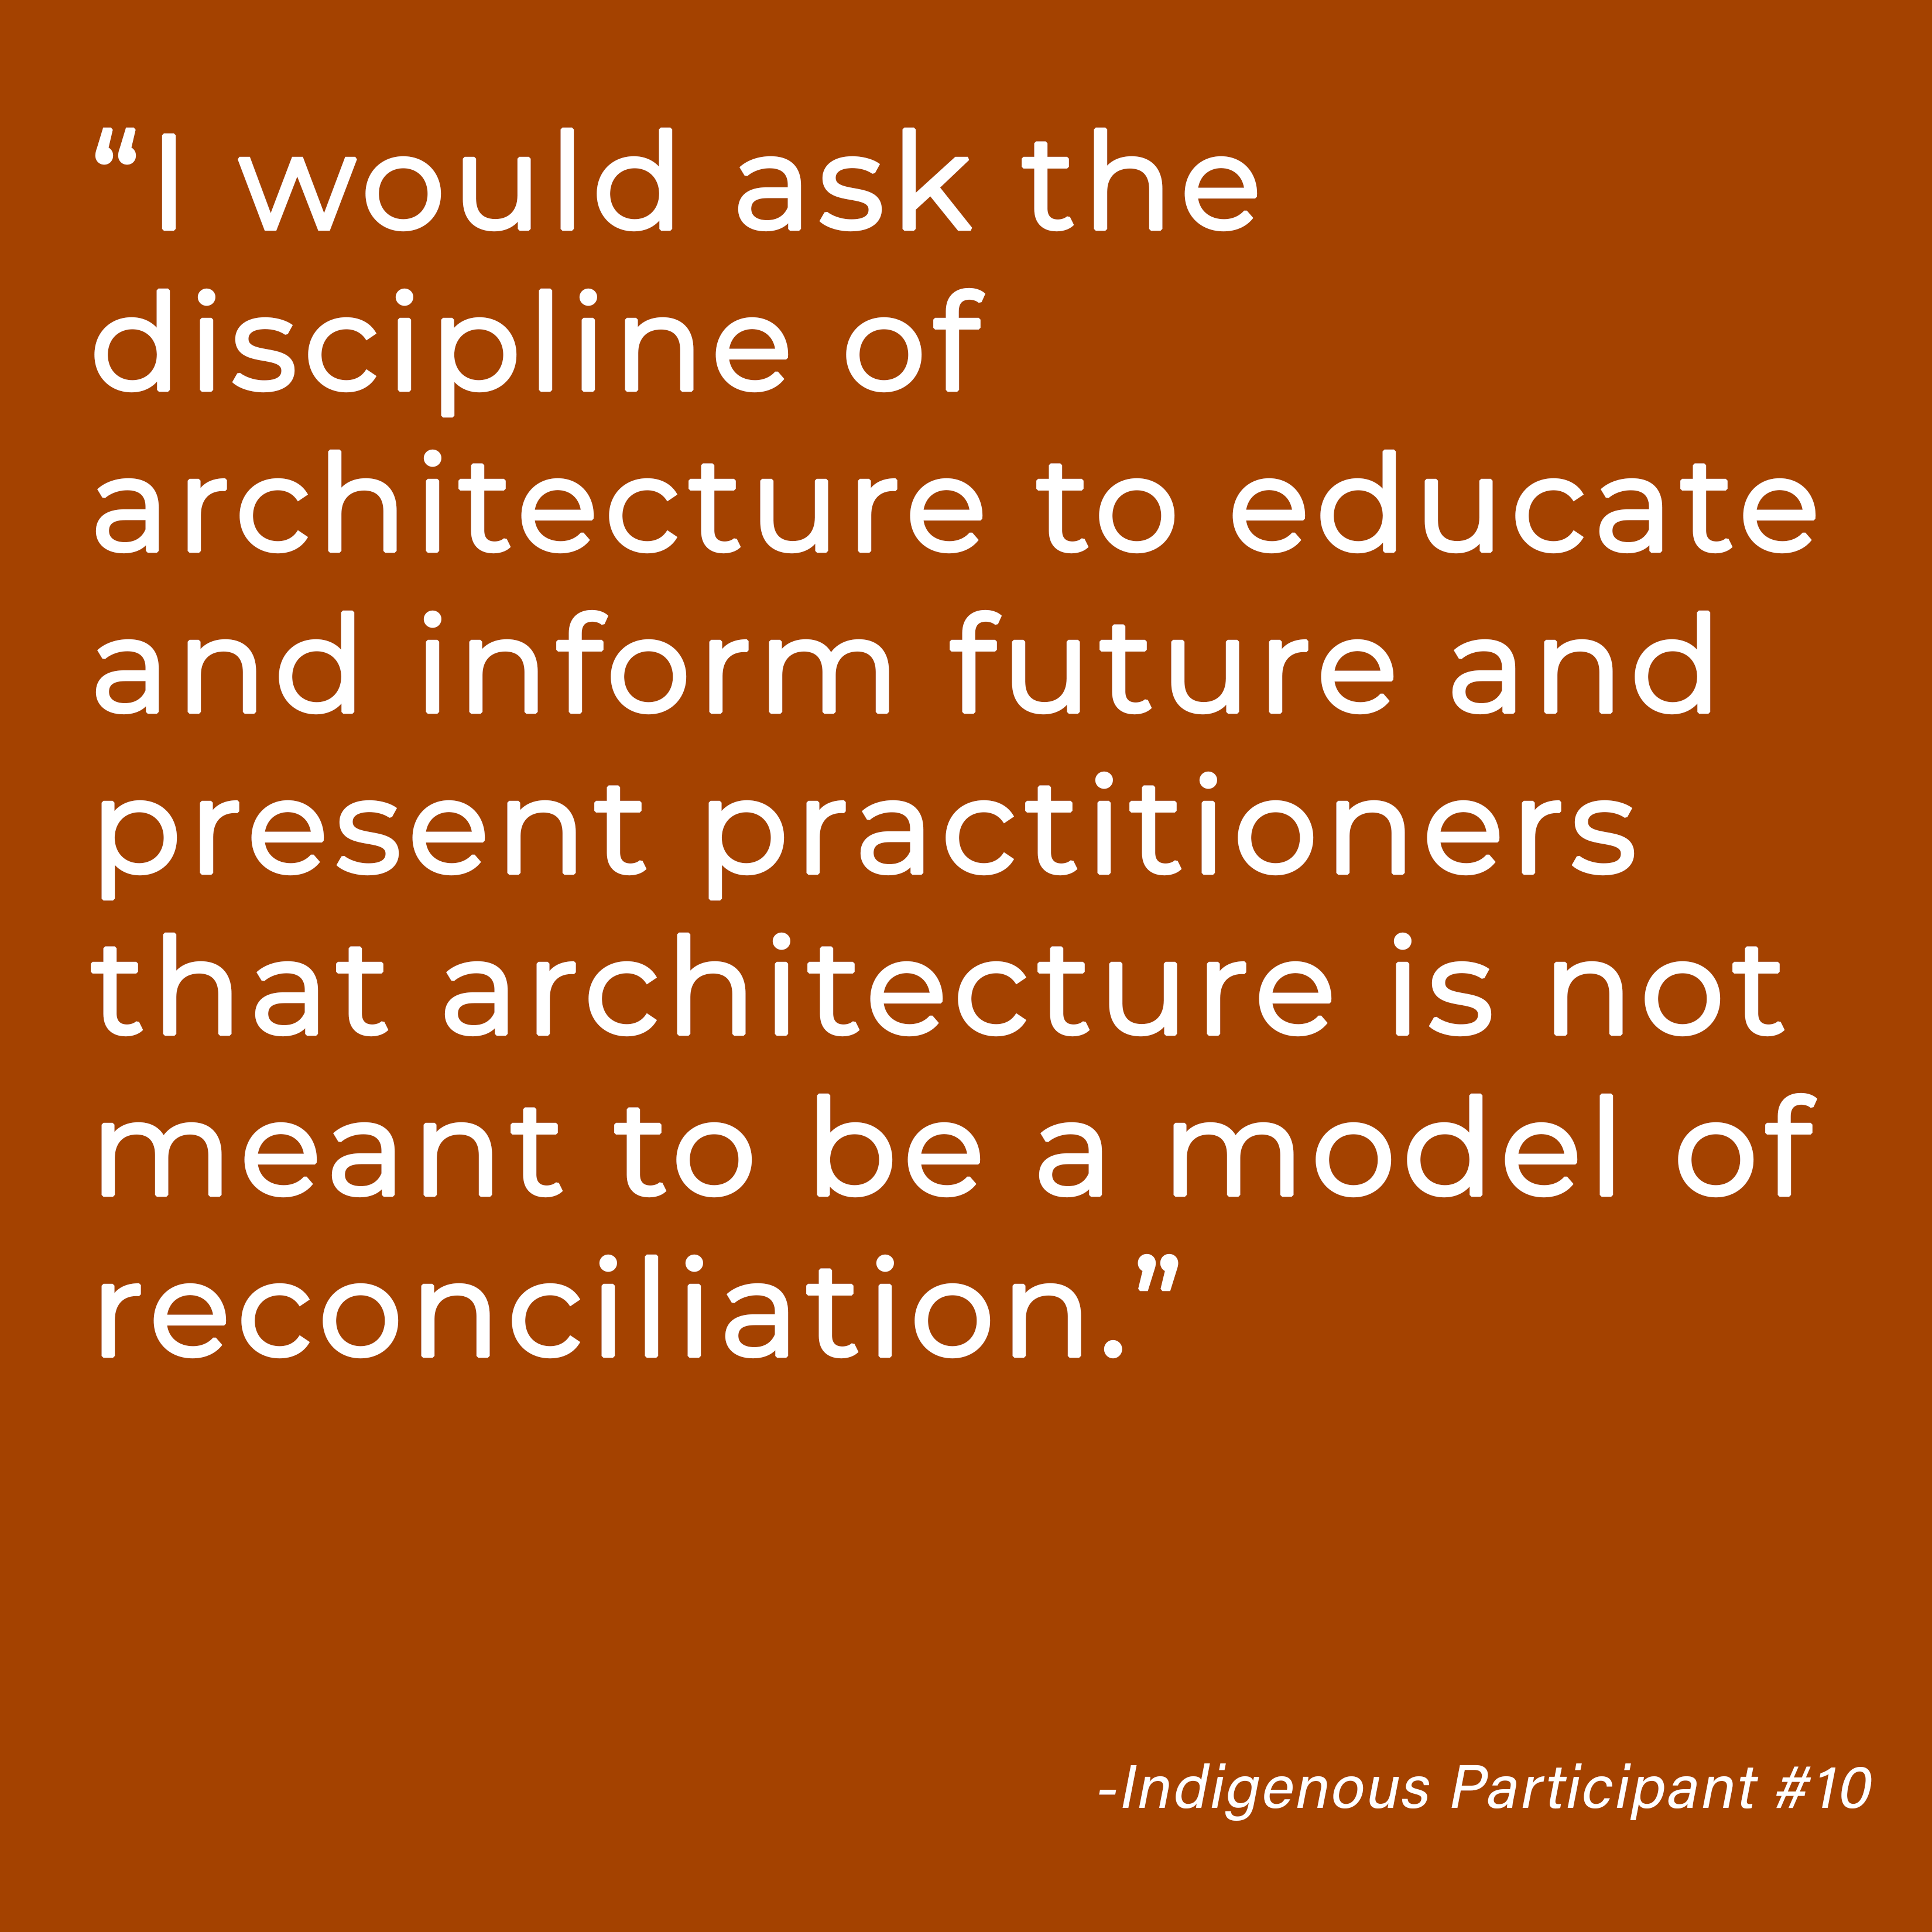
We recognize that this article doesn’t even begin to address the extent of harm done against Native and Indigenous peoples. The hope is that, each person reading this will not only consider the role they play in supporting Indigenous design practices, but also consider the reverence of the land we inhabit. This place is made better when we can hold each other accountable for the damage done to one another and learn how empathy creates a more productive, collective, built environment. Our history and our present day disparities indicate we, as architects, designers, educators and students, have a lot of work to right the wrongs and share the mainstage.
Questions
Kendall Nicholson, Ed.D.
Director of Research + Information
202-785-2324
knicholson@acsa-arch.org

 Study Architecture
  ProPEL