Where Are My People? Asian American, Native Hawaiian, and Pacific Islander in Architecture
Where Are My People? Asian American, Native Hawaiian, and Pacific Islander in Architecture
Kendall A. Nicholson, Ed.D., Assoc. AIA, NOMA, LEED GA
ACSA Director of Research and Information
December 18, 2020
The history of racism, injustice, and disenfranchisement is no stranger to architecture. Where Are My People? is a research series that investigates how architecture interacts with race and how the nation’s often ignored systems and histories perpetuate the problem of racial inequity. Asian American, Native Hawaiian, and Pacific Islander in Architecture chronicles both societal and discipline specific metrics in an effort to highlight the experiences of designers, architects and educators of Asian, Hawaiian and Pacific Island heritage. This research report follows the first two parts of the series, Where Are My People? Black in Architecture and Where Are My People? Hispanic and Latinx in Architecture.
For the purpose of this research, I will use the terms Asian American, Native Hawaiian (or Hawaiian), and Pacific Islander to discuss the challenges of three distinct people groups that America has often made little distinction between. I acknowledge that historically the term Asian has been used as an umbrella to include the many ethnic groups living on and tangential to the continent of Asia. I will try to provide some distinctions here that better reflect the differences in culture, language, ways of immigration and the relative forms of discrimination. This time we are asking “What does the term ‘model minority’ mean?”, “How can you be the model minority and still be disenfranchised?”, and “What are the histories that support feelings of disenfranchisement?”.
Asian Americans, Native Hawaiians, and Pacific Islanders tirelessly combat the label of “other”. Even the spelling of the term Asian American is intentional in that the hyphen between Asian and American was consciously dropped in an effort of activism to identify the word Asian as an adjective for the word American. Going from “Asian-American” to “Asian American” is one way the Asian community at large stakes claim to being American. The history of othering dates back centuries with legislation such as the Chinese Exclusion Act of 1882 where severe restrictions were placed on Asian immigrants until a complete ban was implemented by the 1924 Immigration Act. It wasn’t until US legislation aimed to exclude another Asian population, Japanese Americans, that a second wave of Chinese immigrants would return to the United States.
After the bombing of Pearl Harbor in 1941, then US President Franklin D. Roosevelt signed Executive Order 9066 which made possible the incarceration of approximately 120,000 Japanese Americans which are often referred to as internment camps. Each Asian subgroup has a very distinct history of migration which directly affects the lived experience of their descendants today. Koreans and Filipinos largely migrated by way of available work on Hawaiian plantations and many Southeast Asians have histories that required migration with the hopes of seeking refuge. Native Hawaiians and Pacific Islanders have histories that center around colonialism instead of migration but also affects their lived experiences as “other Americans.”
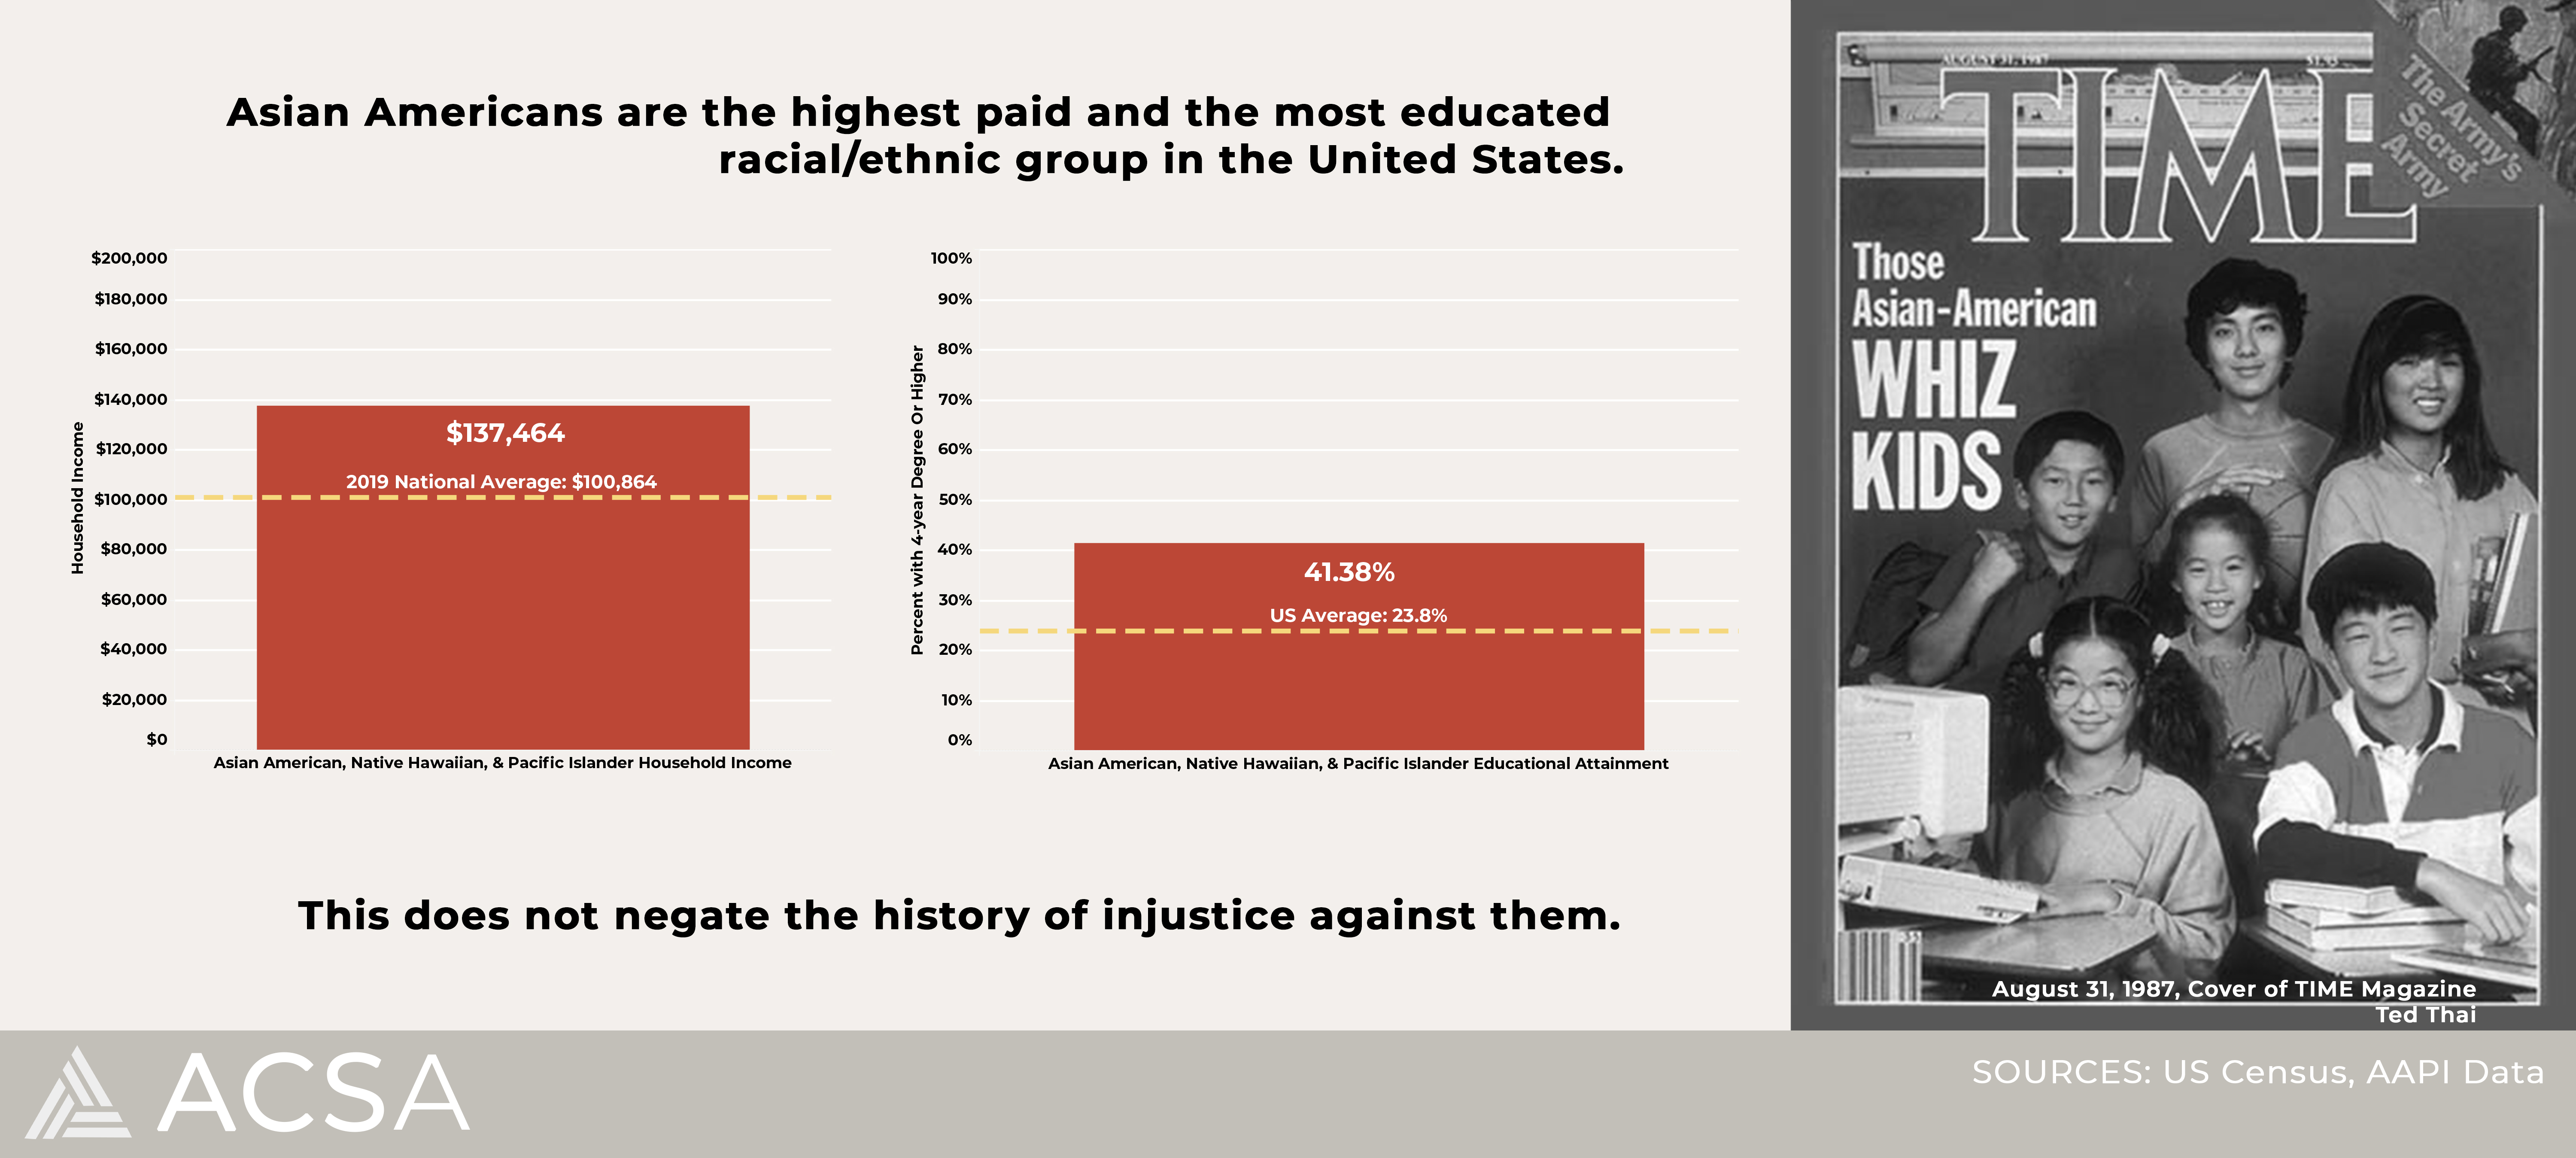
The history of the “model minority” dates back to 1966, in the midst of the Civil Rights movement, where the term was coined in a New York Times article about the success of “Japanese-Americans”. This article, authored by William Pettersen, chronicles the history of exclusion and transgression against Japanese and Chinese Americans to which they have overcome. Pettersen, gives a metaphorical pat on the back for the unyielding perseverance exhibited by the Japanese, citing obstacles such as “poor health…low income…high crime…and so on.” In the 1987 Time magazine cover article pictured above, David Brand opens the piece with the following set of offensive observations:
“Some are refugees from sad countries torn apart by war. Others are children of the stable middle class whose parents came to the U.S. in search of a better life. Some came with nothing, not even the rudiments of English. Others came with skills and affluence. Many were born in the U.S. to immigrant parents.”
These articles, in addition to other similarly expressed sentiments in news and media, are problematic for a number of reasons. Not only does the narrative of the “model minority” inaccurately represent an increasingly diverse group of people, but it also serves as an intentional way to draw division between people of color. As previously stated, the term was introduced in the middle of a fight for equality led in large part by the African American community. While it is true that Asian Americans have an average household income that is nearly $37,000 above the US mean and they boast the highest levels of educational attainment, the vast amounts of discrimination felt by community members leads to overwhelming opportunity without ownership.
Moreover, this label is also problematic because there has and continues to be a lot of confusion about the distinction between Asian ethnic groups and Pacific Islanders. That being said, the myth of a “model minority” often extends to Native Hawaiians and Pacific Islanders no matter their heritage.
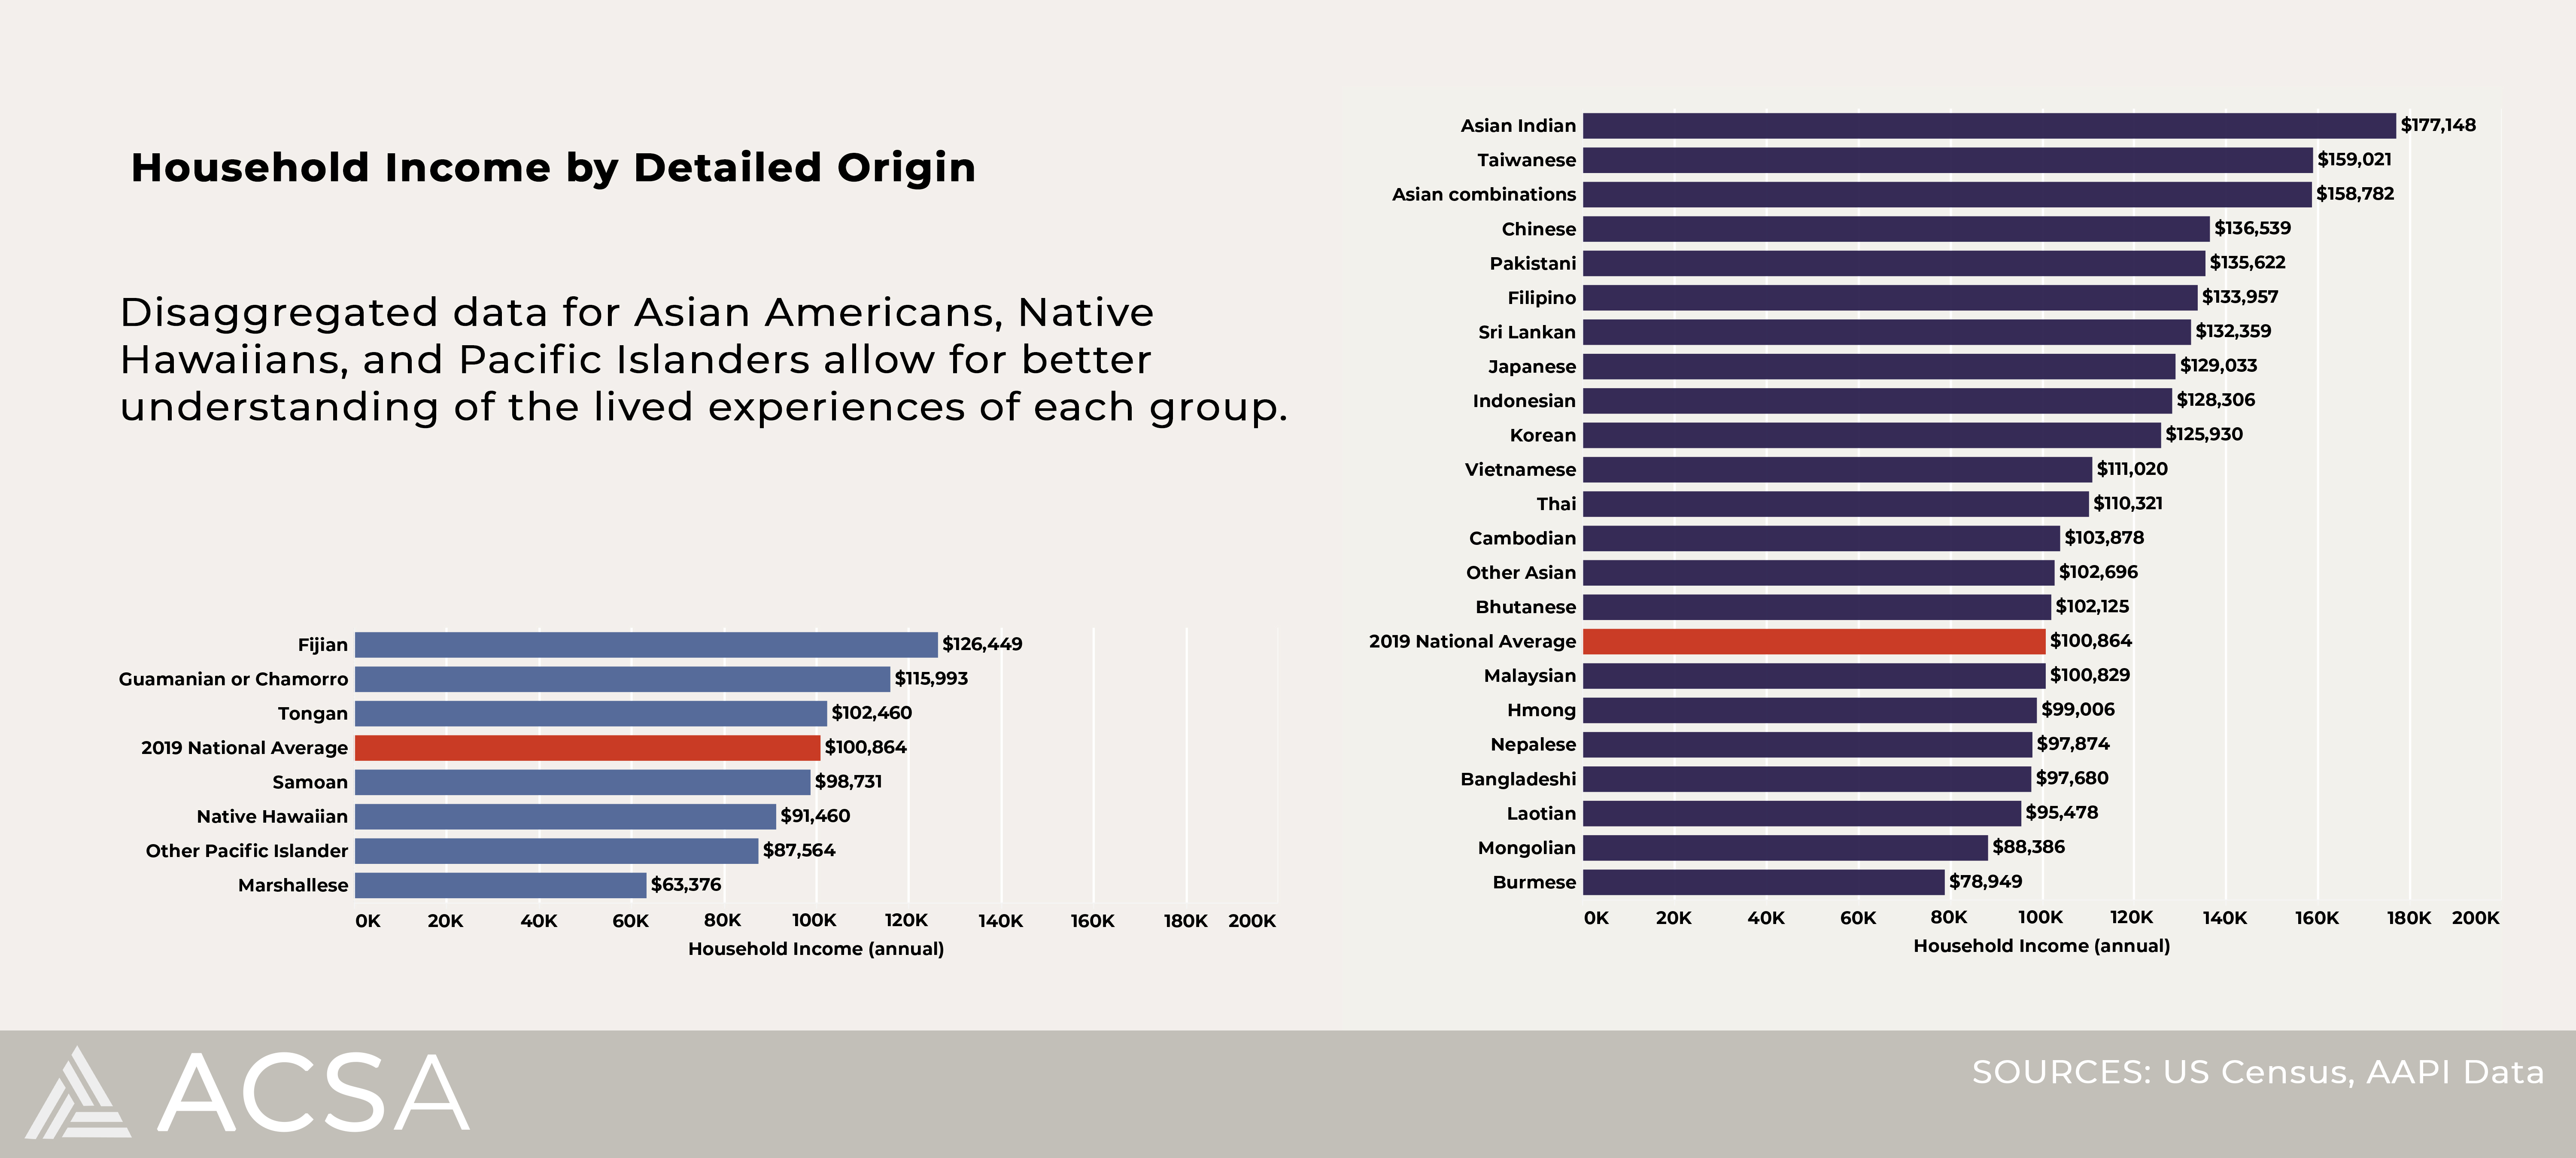
As shown above, the myth of the “model minority” supports the idea that the Asian American, Native Hawaiian, and Pacific Islander (AANHPI) communities are not monoliths. Confounding evidence also notes concentrations of AANHPIs in areas that have higher costs of living, i.e. California. Additionally, the higher levels of educational attainment shown below are also tied to an increased earning potential and subsequent income.
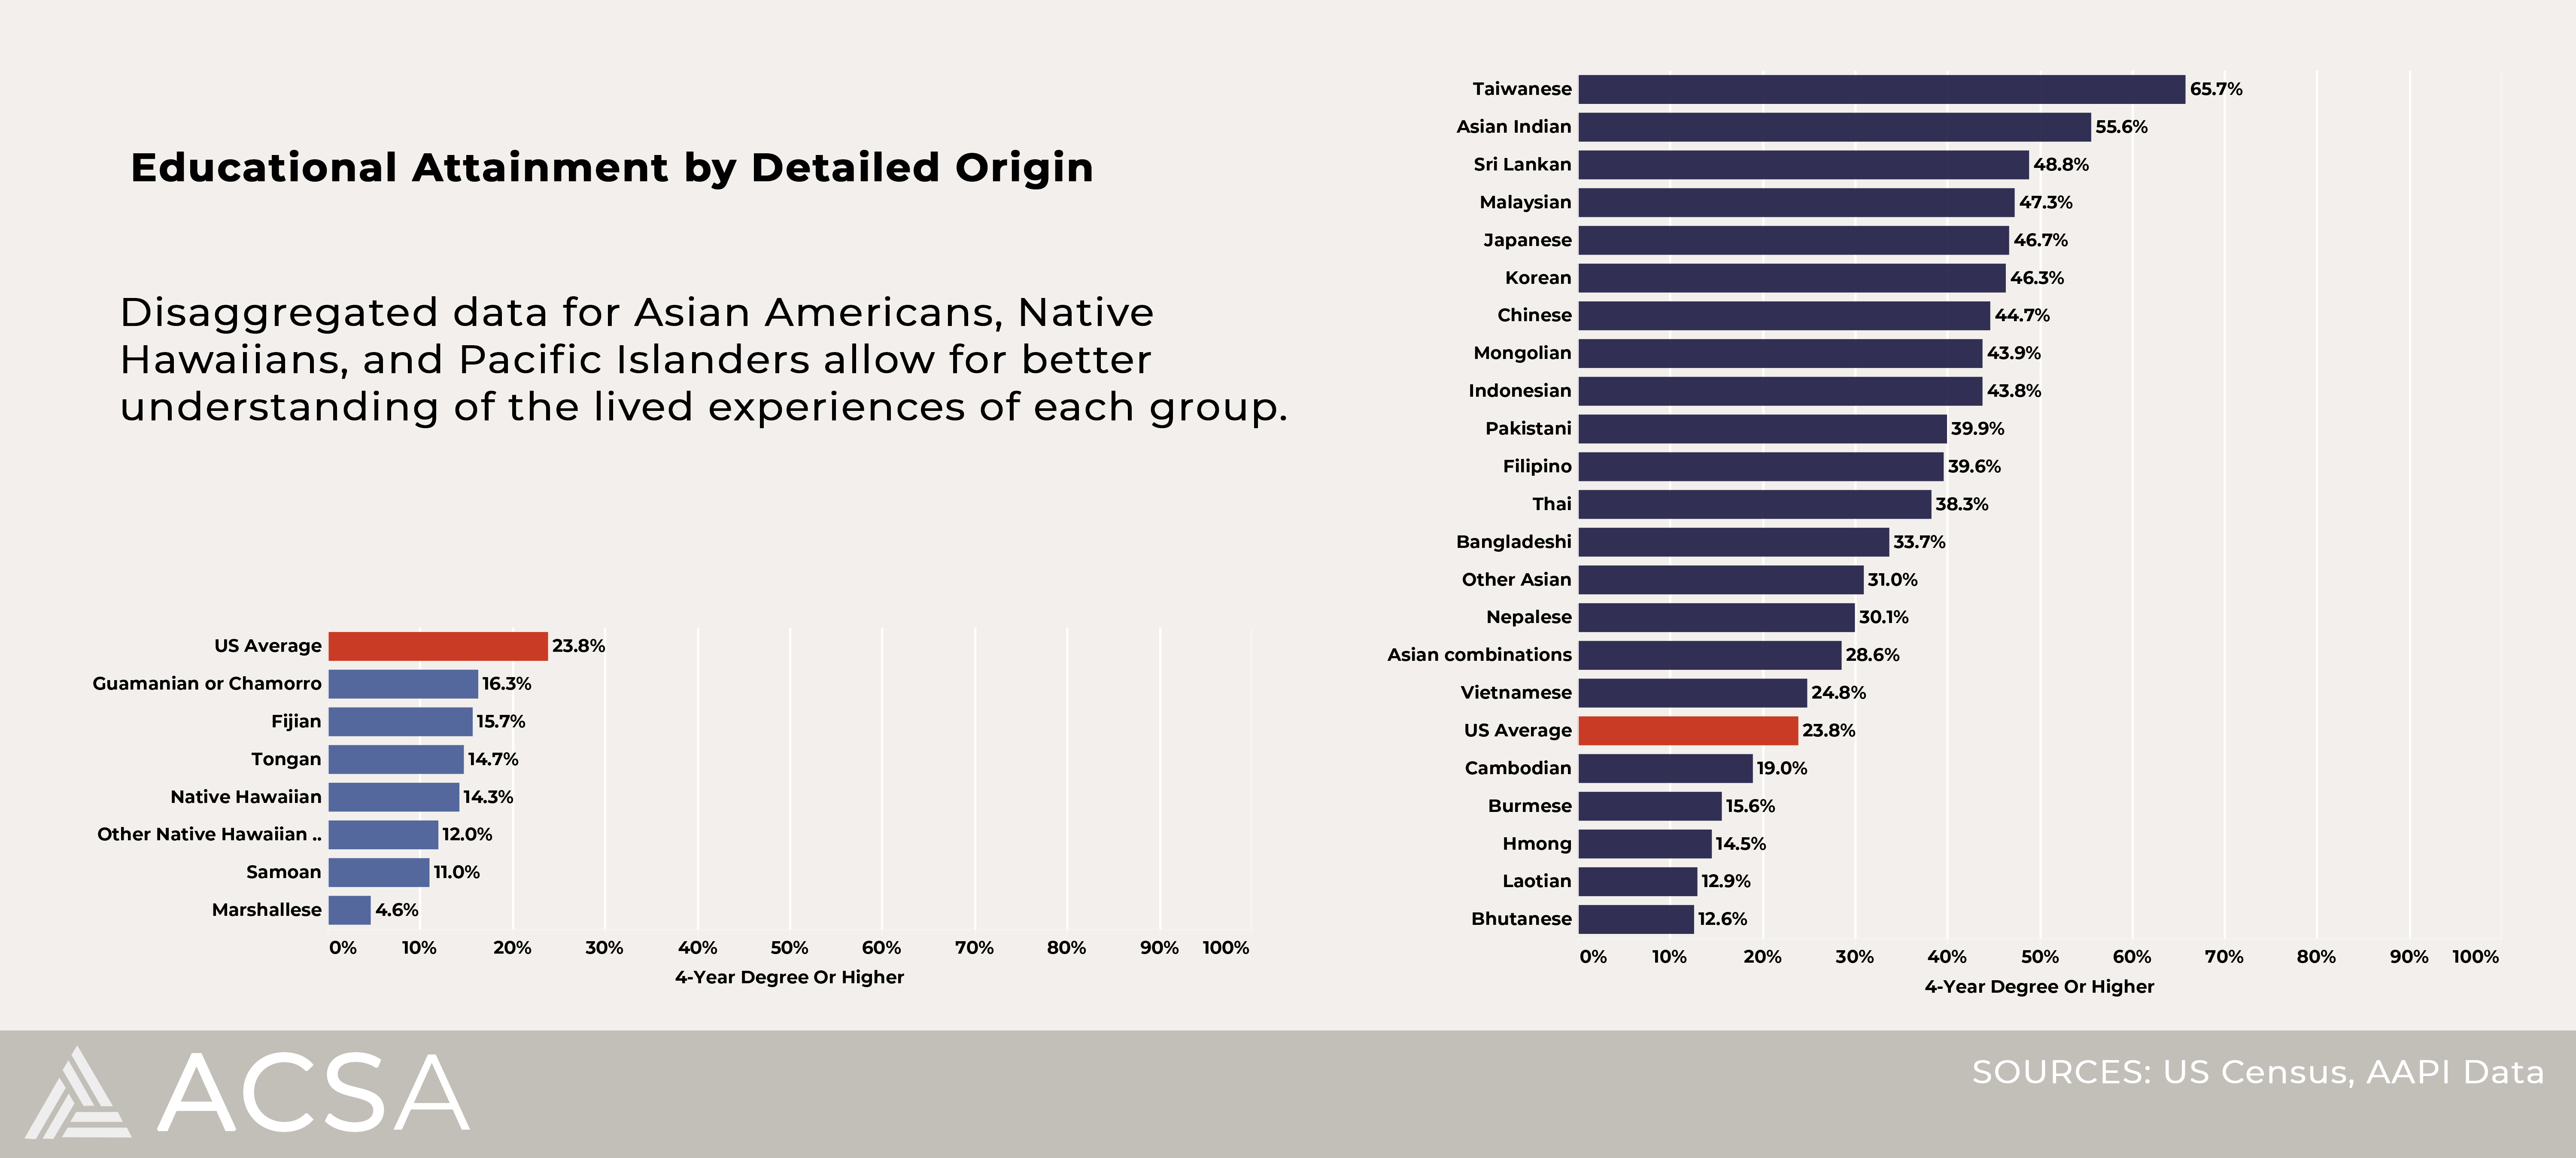
Here the myth of the “model minority” shows a great disparity between the educational attainment of Native Hawaiians and Pacific Islanders and their Asian American counterparts. Many of the Asian American ethnic groups above the US average experience what sociologists call hyperselectivity. This hyperselectivity for American migration explains why only 4 percent of adults in China have an undergraduate degree but just over half of the Chinese immigrants coming to America have an undergraduate degree and a fourth are coming with advanced graduate degrees.
Understanding the context of income and education, it should come as no surprise that the Asian American population of architecture graduates across 2-year, 4-year and graduate programs are well aligned with the percent of Asian Americans in the total US population (6.0%), with less than half of those students being awarded 2-year degrees. Among schools with a NAAB accredited program the percent of Asian American students rises to 8.2% and 9 out of every 10 NAAB schools has at least one Asian American student represented.
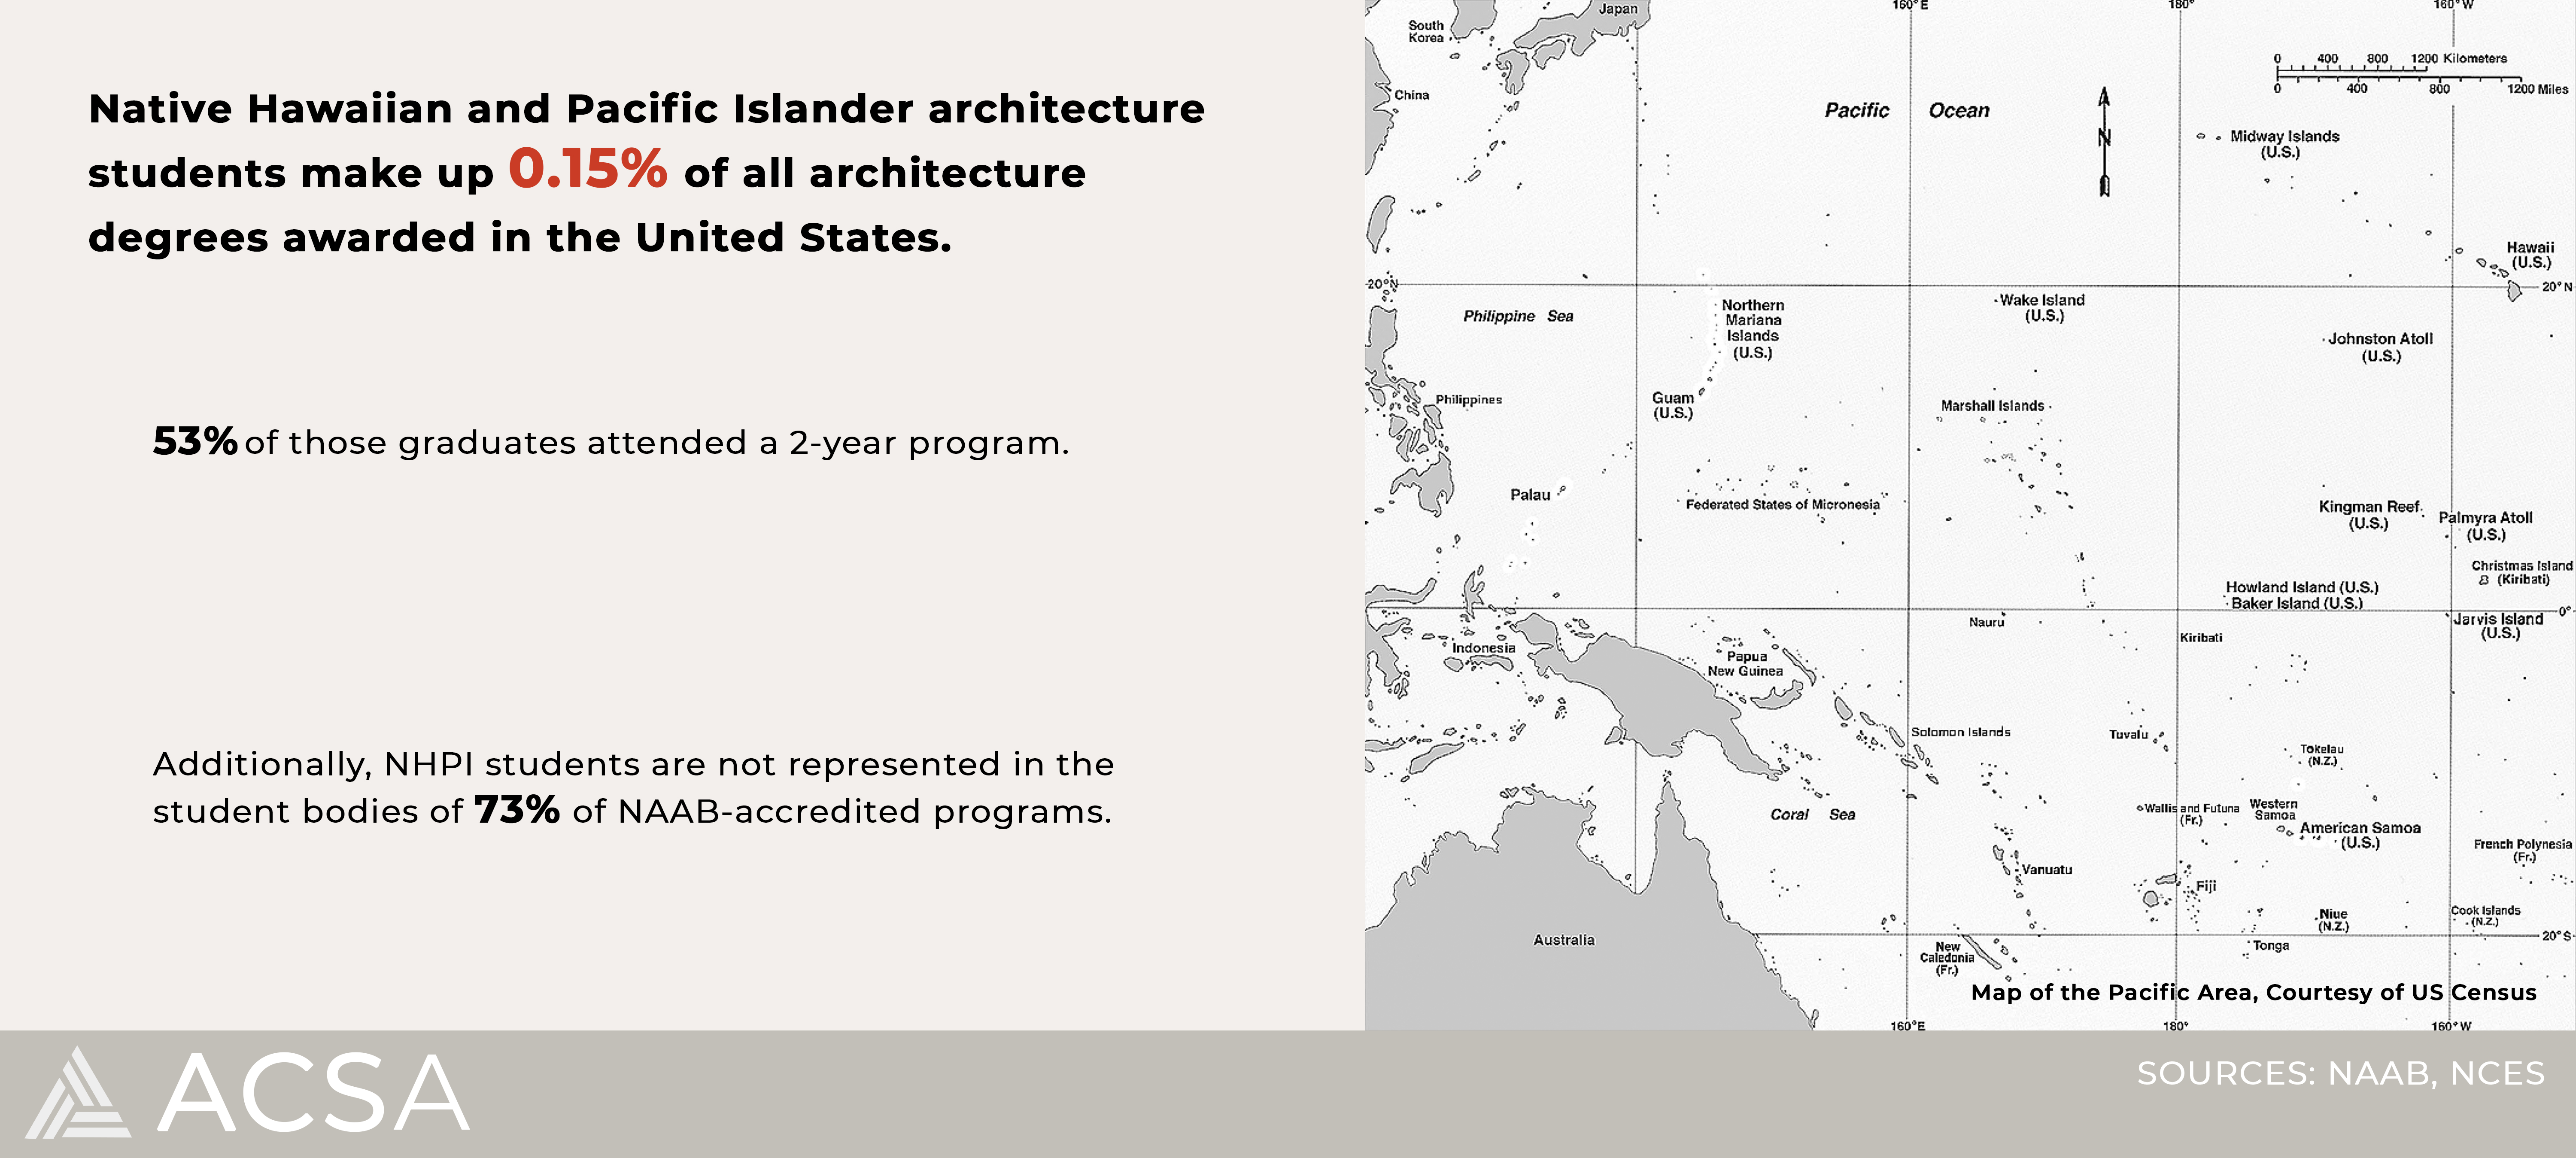
Native Hawaiians and Pacific Islanders are also graduating at a rate that is on par with the percent of Native Hawaiians and Pacific Islanders in the United States (0.15%). The issue here is that the number is so small. On top of that, there is a slight majority of students graduating from 2 year programs meaning their earning potential is going to be less. Moreover, only 27% of NAAB-accredited schools have 1 or more Native Hawaiians and Pacific Islander students and very few (9%) have 2 or more.
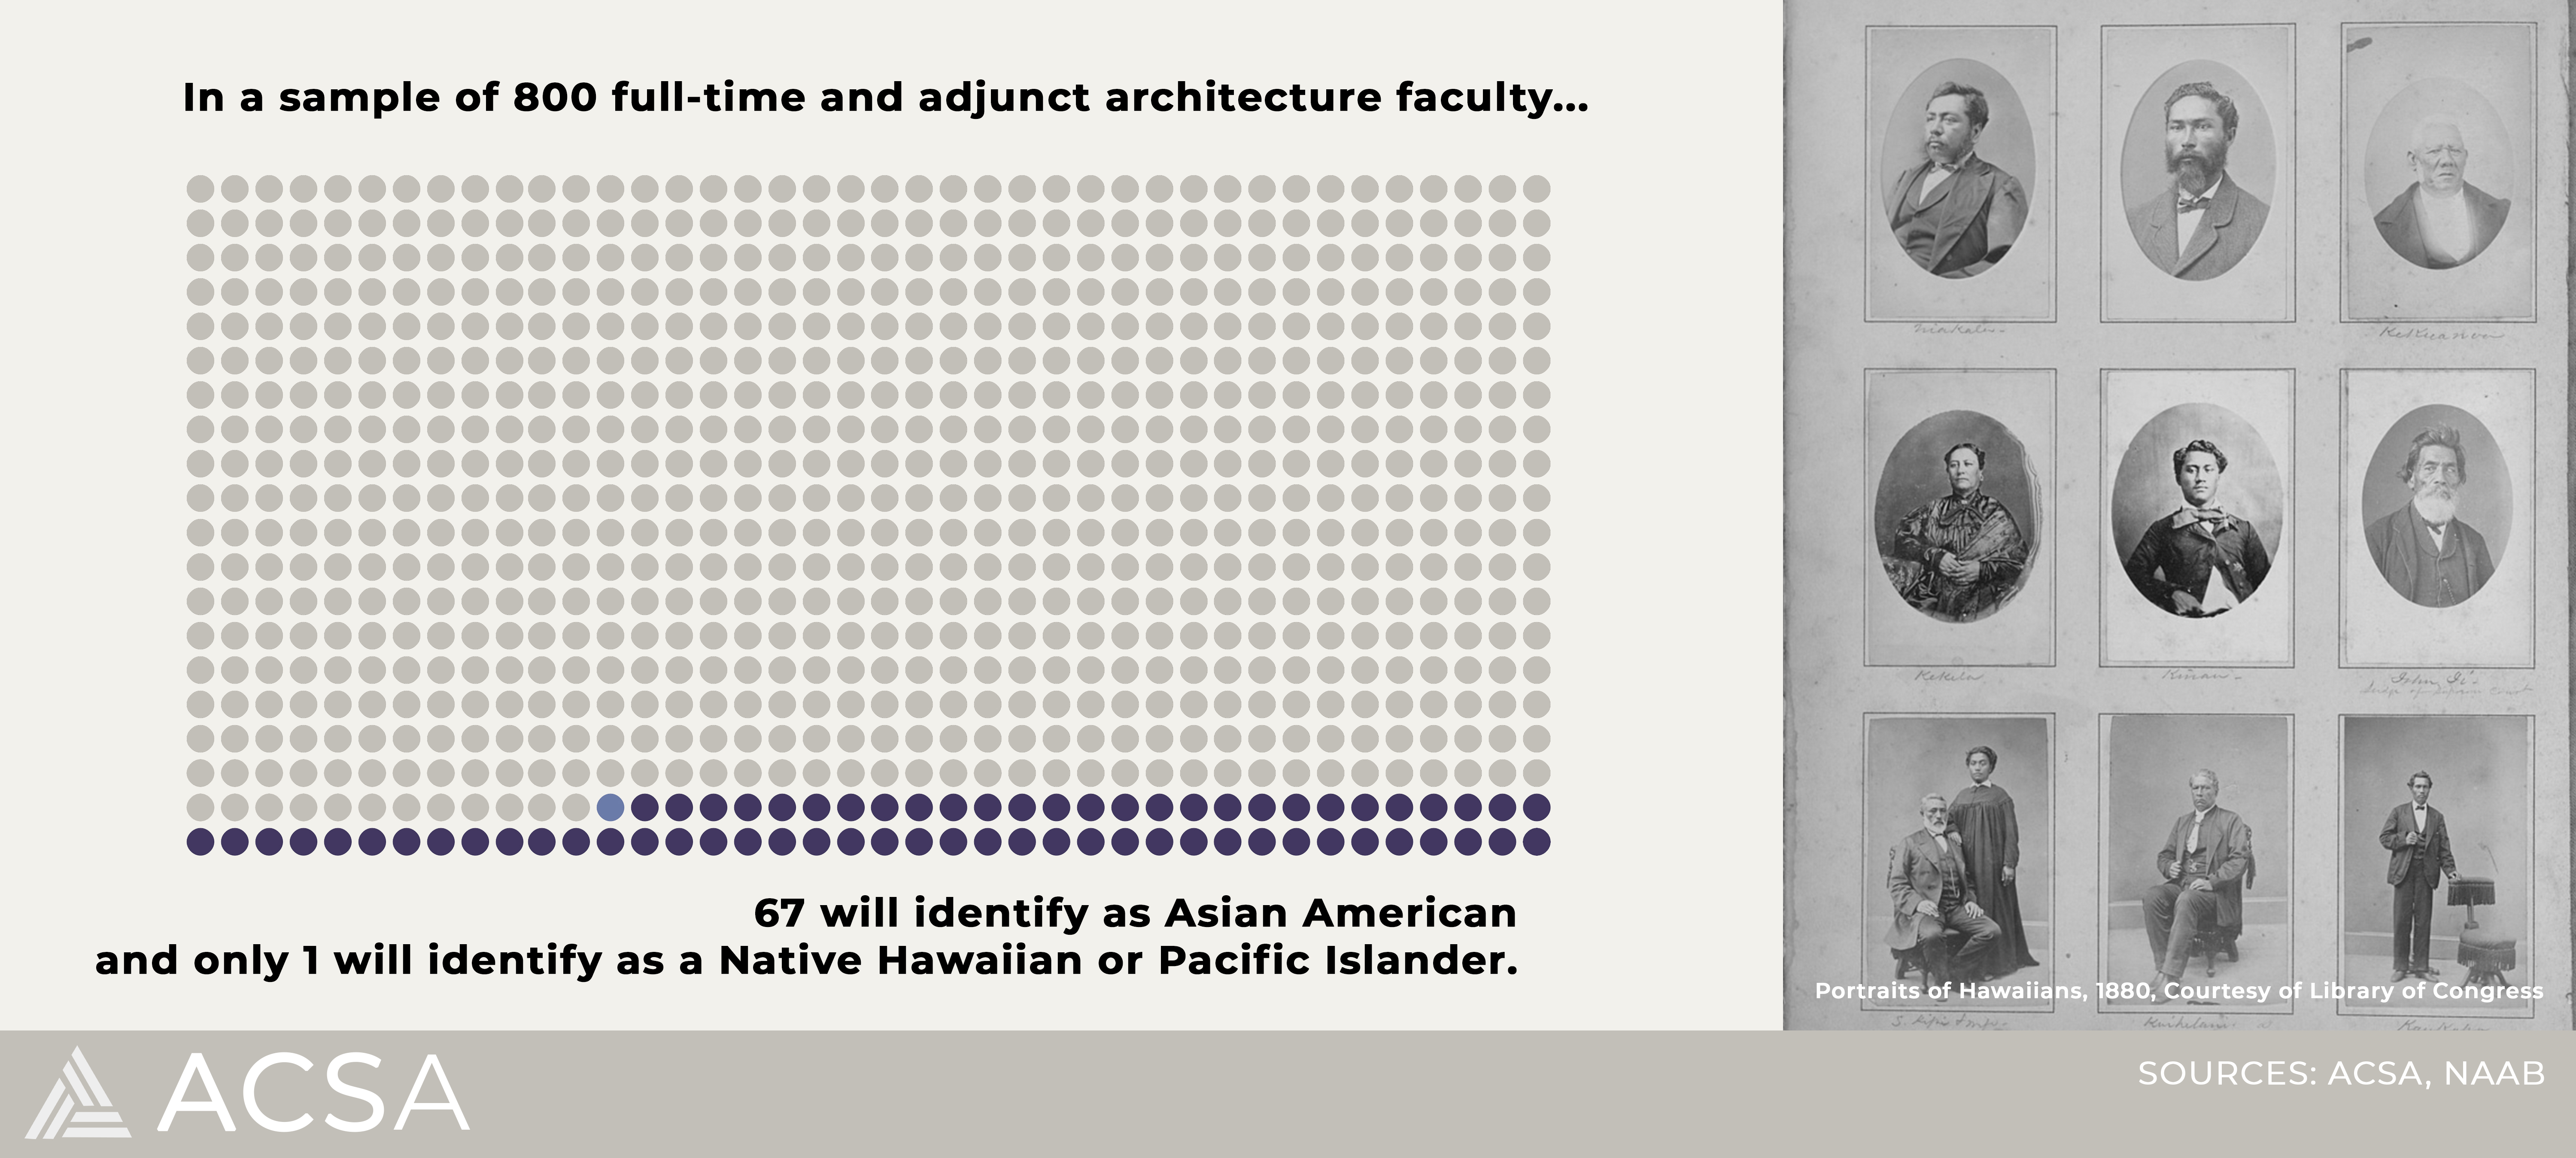
The most salient point here is that in a sample of 800 architecture faculty at NAAB-accredited schools of architecture, there would only be 1 Native Hawaiian or Pacific Islander faculty member. This is an area where representation matters. It’s important for architecture students to understand a variety of perspectives and with the extremely small numbers of Native Hawaiians and Pacific Islander both as students and faculty in architecture, not only are they siloed but there is also very little opportunity for non-Native Hawaiians or Pacific Islander to gain the perspective and cultural competence offered by people from this region of the world.
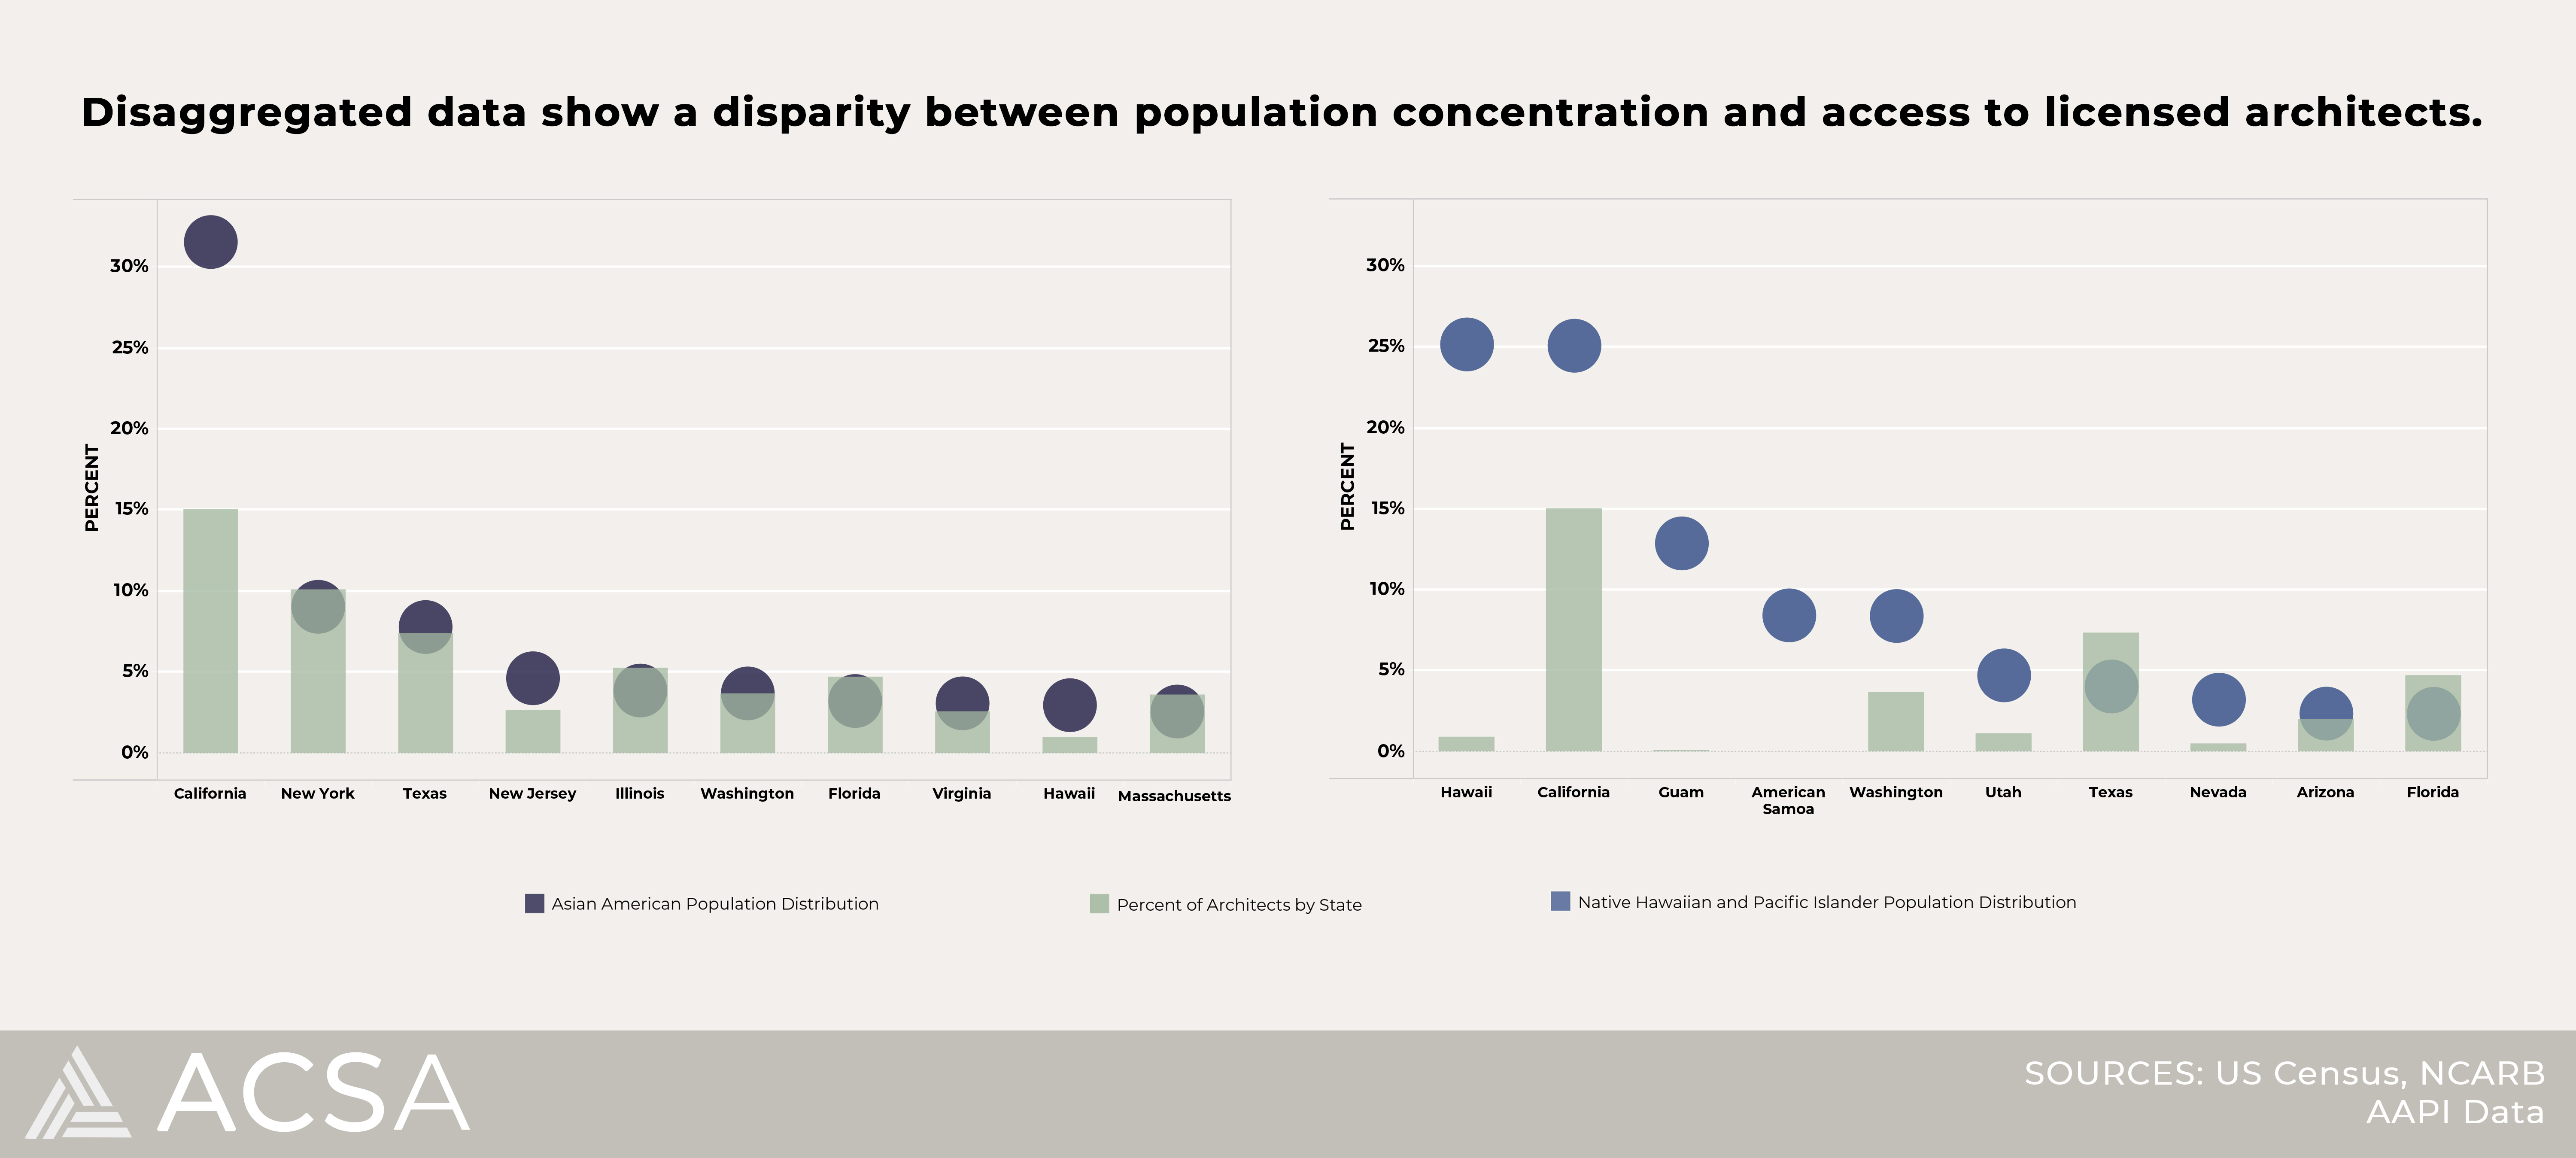
This set of graphs shows just how important it is to disaggregate data for Asian Americans, Native Hawaiians and Pacific Islanders. Each graph shows where the highest concentration of people from a specific group live in the United States. Coupled with that is data from NCARB showing the percent of licensed architects living in that state or territory. The graph on the left showing Asian American population distribution, shows a convergence of architects and the Asian population in seven of the top ten localities. However, the graph showing Native Hawaiian and Pacific Islander population distribution shows a great disparity between the percent of licensed architects and the percent of Native Hawaiians and Pacific Islanders in each state or territory.
Note: There is no data from NCARB on American Samoa as it is not a jurisdiction regulated by NCARB.
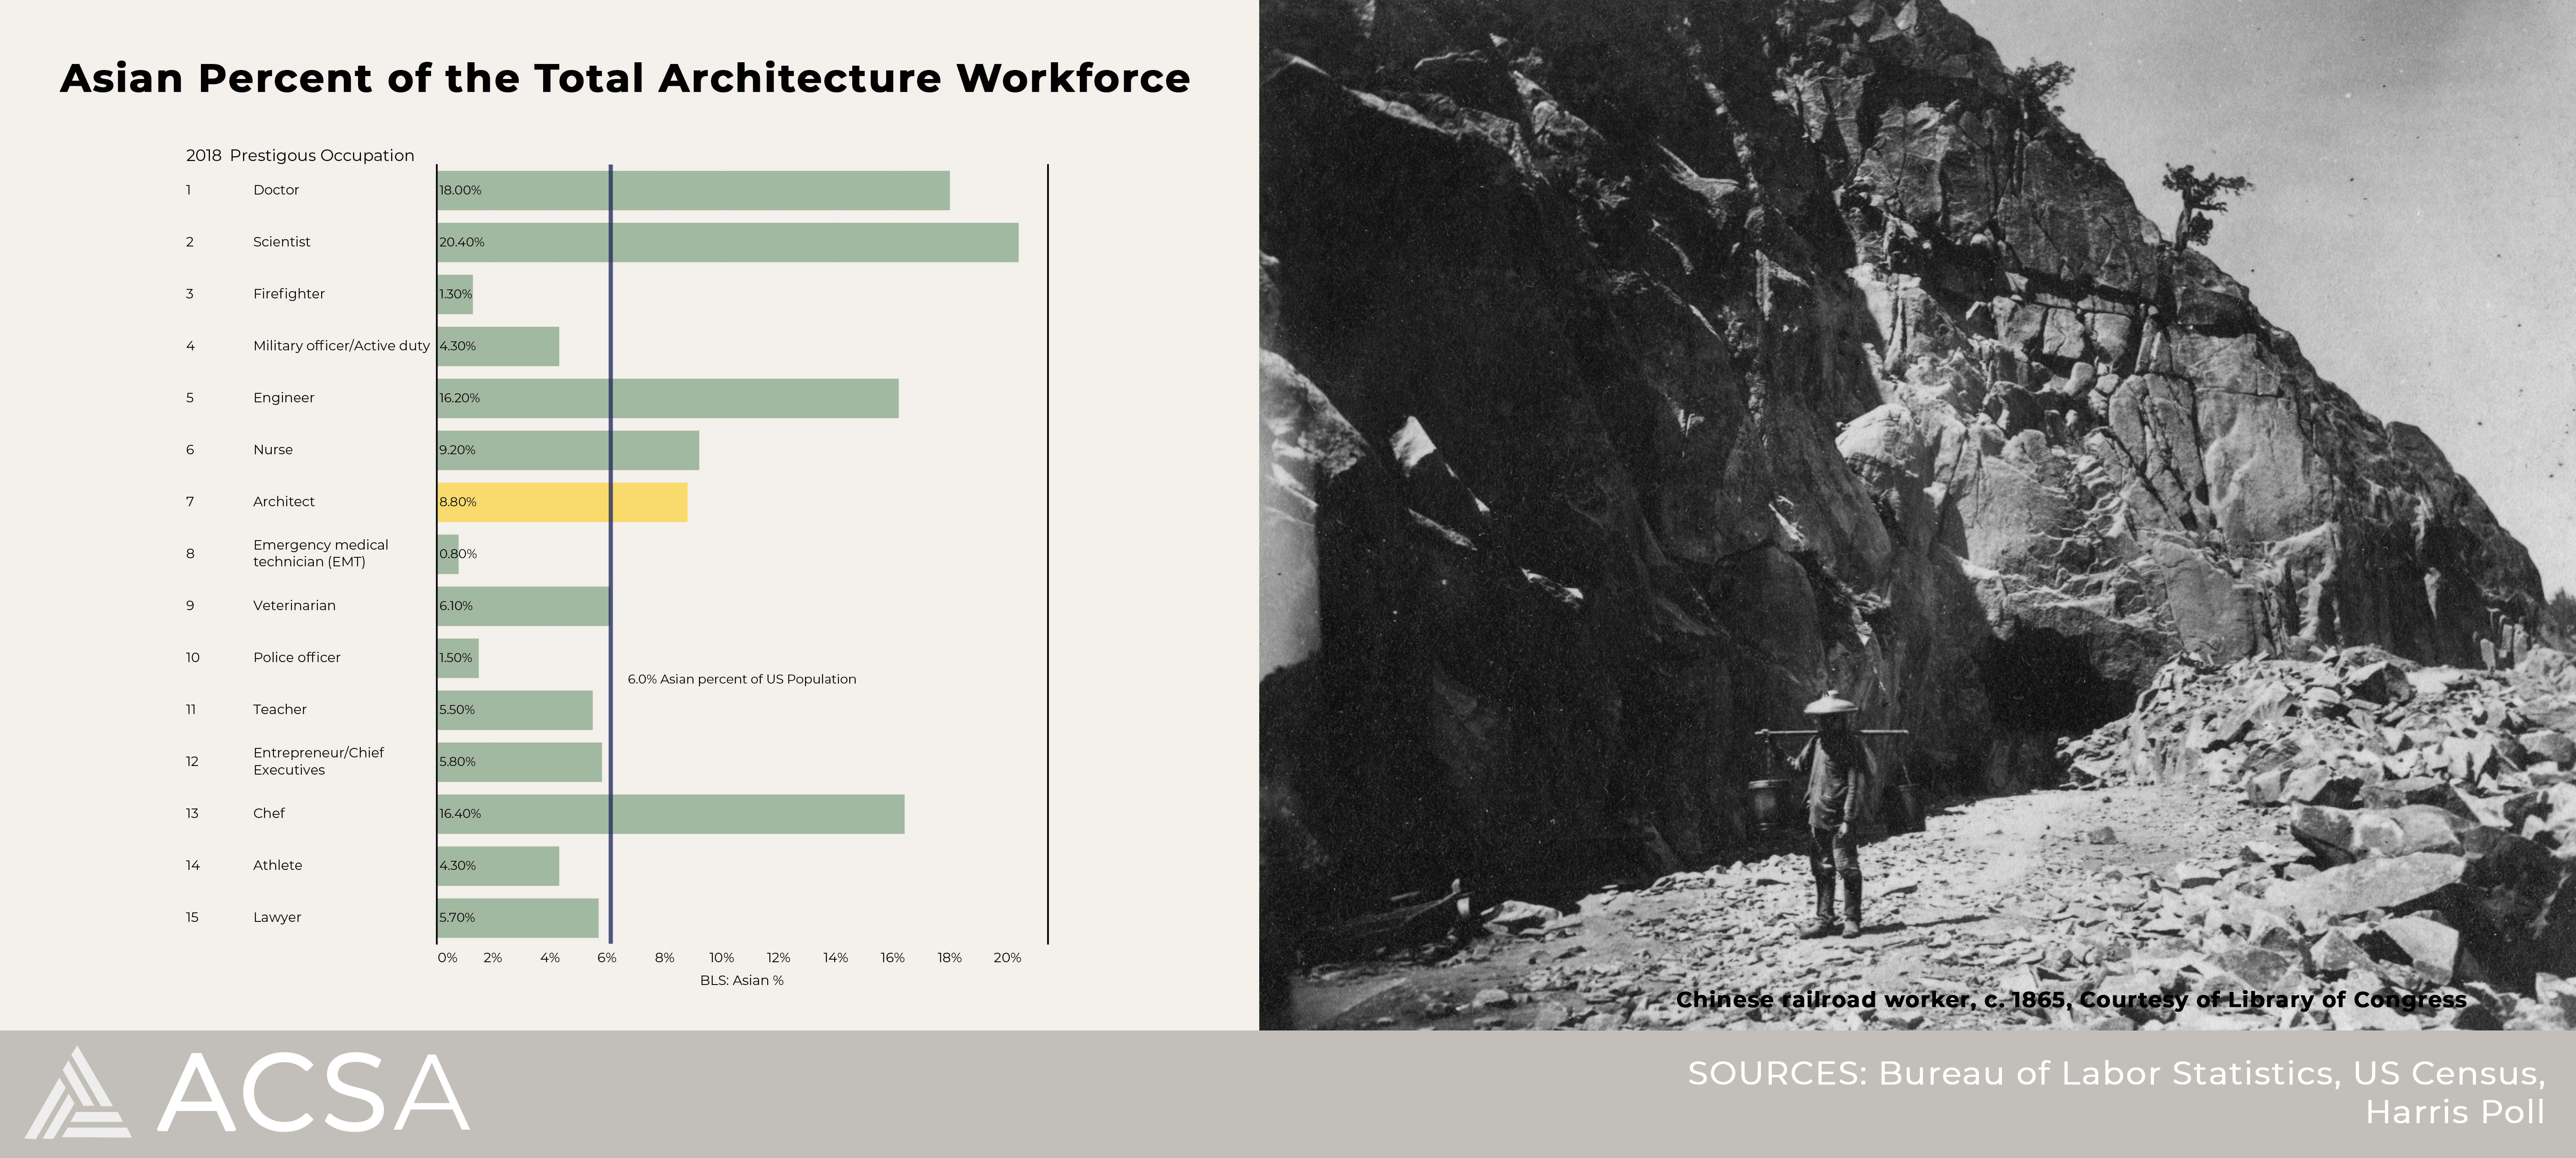
As mentioned in the Where Are My People? Black in Architecture report, every 2 or 3 years the Harris Poll conducts a survey of the most prestigious occupations as perceived by Americans across the country. Architects have made the list in almost every iteration of the survey. In 2017, architects ranked seventh on the list following other mainstay professions such as doctors, firefighters and nurses. While architects are known as notable and prestigious professional members of society, they are not often perceived as socially relevant. However, of the top 15 prestigious occupations, architects came in sixth place if ranked by the percent of Asian workforce in the profession. These data beg the question “Why is that Asians choose architecture over the military or becoming an athlete?”
This investigation of Asian Americans, Native Hawaiians and Pacific Islanders just scratches the surface. The biggest issue found in this inquiry was that of representation of Native Hawaiians and Pacific Islanders in schools of architecture and the profession. At present, there is little data publicly available for this group as it relates to the profession.
Questions
Kendall Nicholson, Ed.D.
Director of Research + Information
202-785-2324
knicholson@acsa-arch.org

 Study Architecture
  ProPEL