Budget and Enrollment Survey Results
This year’s Budget and Enrollment Survey reflects budget, applications, enrollment, program metrics, new courses, and academic staffing changes at 83 member schools. The survey was made available to all ACSA member institutions, including 2-year, 4-year, and international programs. The survey is conducted annually and this report includes data collection dating as far back as the 2010-11 academic year. The purpose of this report is (1) to provide a cross-section of information regarding the current status of funding and admissions at architecture schools, (2) identify any ongoing trends survey results may suggest, and (3) answer some frequently asked questions by program administrators. An analysis of the budget and enrollment sections is provided below. Stay tuned for additional findings.
PART 1: ARCHITECTURE PROGRAM BUDGETS
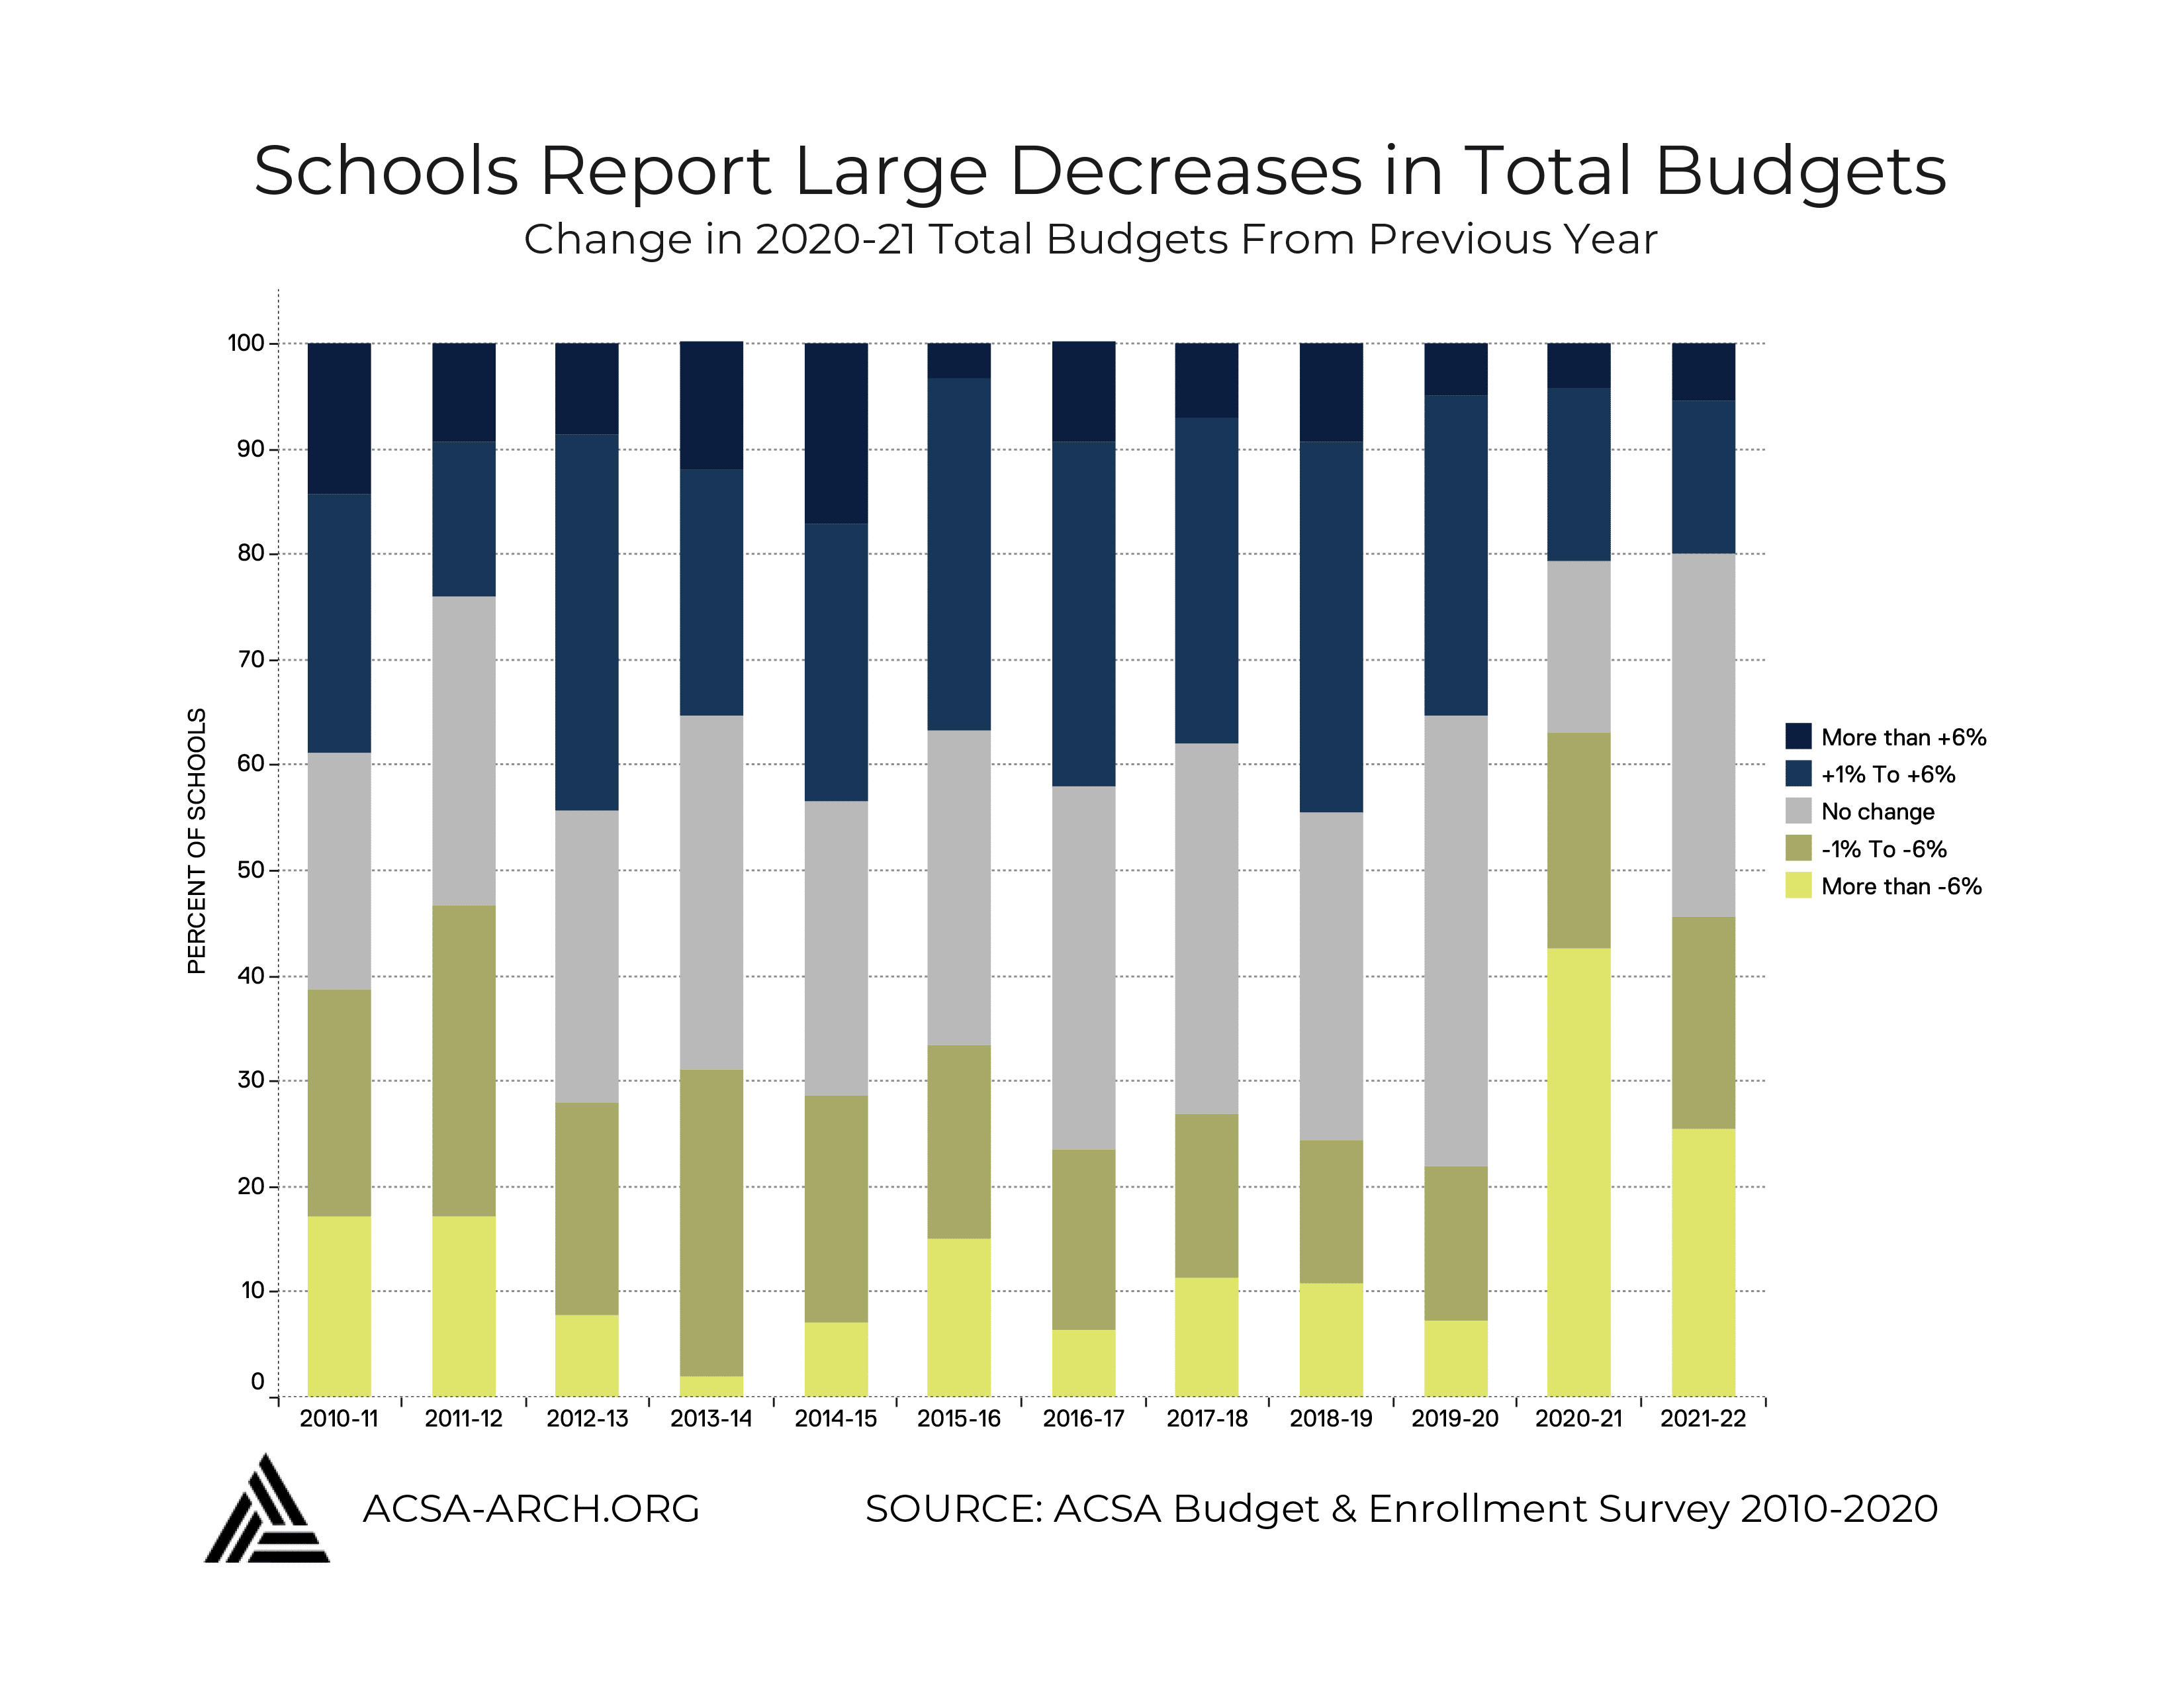
Changes in total budgets across architecture programs showed a significant decrease from last year to this year. While program administrators are optimistic that there will be some rebound in 2021, 63% of programs reported a decrease in their overall budget for 2020-21. More specifically, the percent of programs that reported a large decrease (More than -6%) increased from 7% last year to 43% this year.
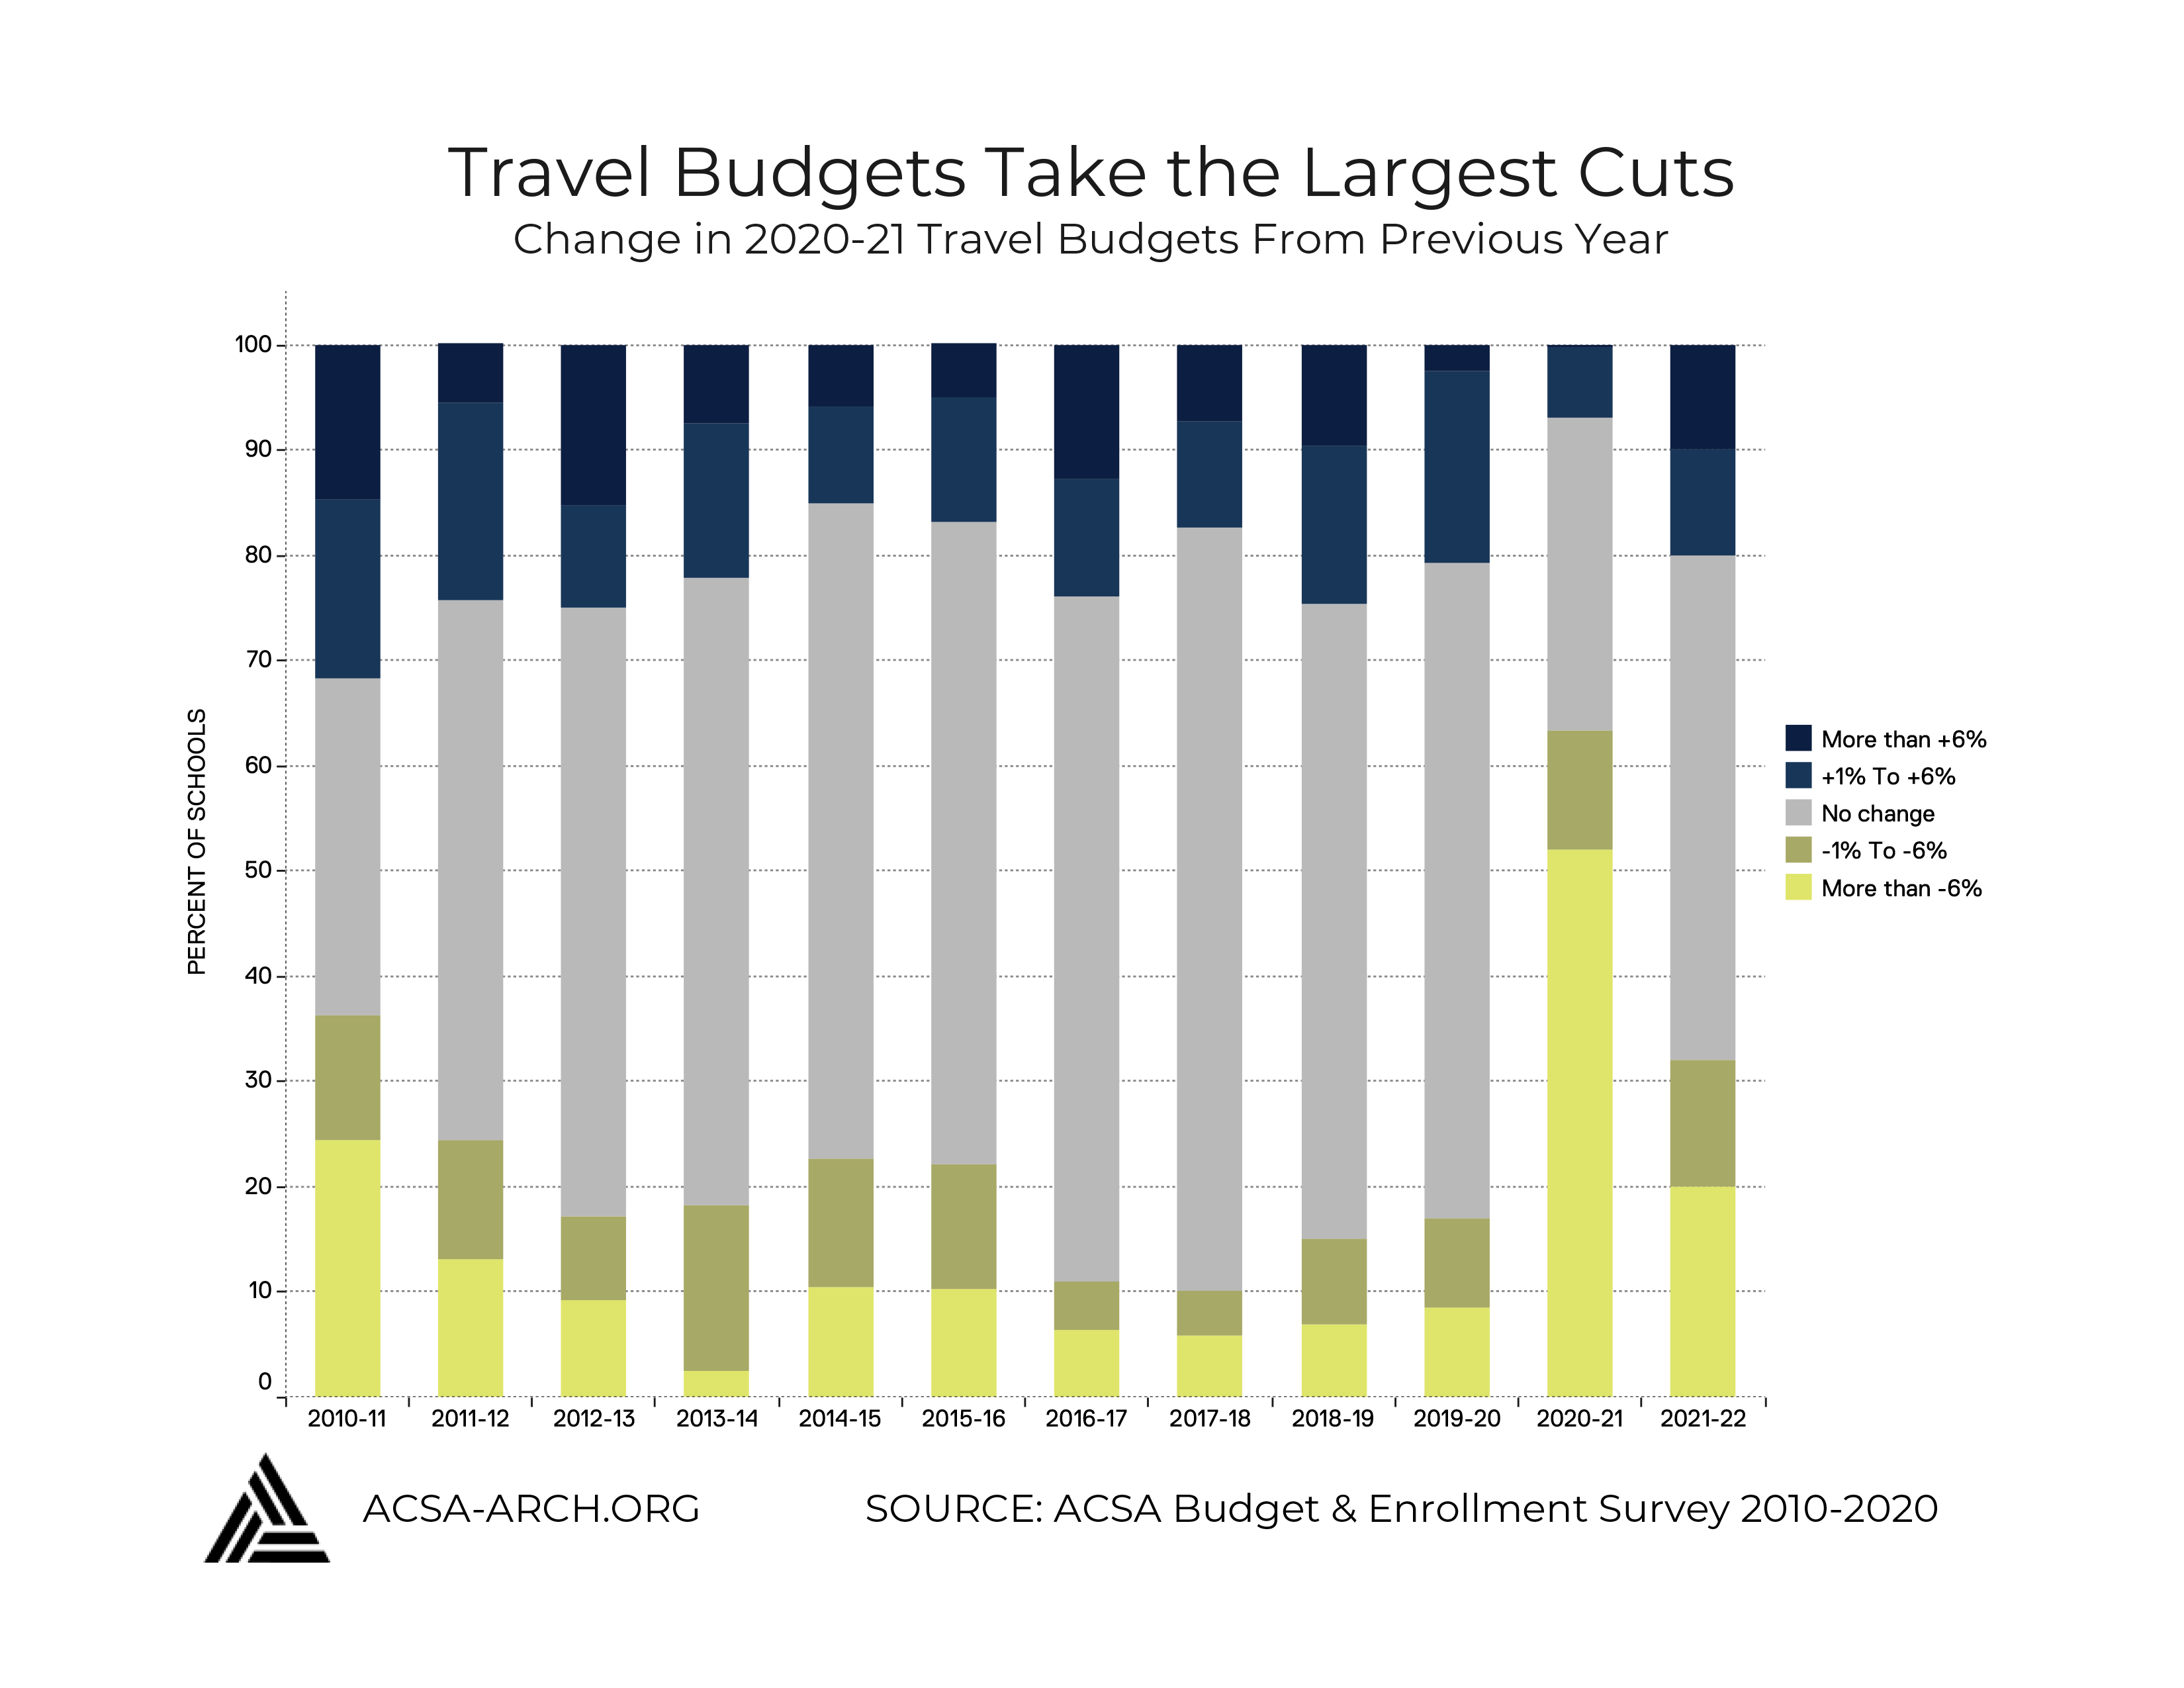
With the increasingly restrictive COVID-19 regulations, it comes as no surprise that travel budgets were hit the hardest. Our research shows that many programs have not been permitted to sponsor school-funded travel. Much like the total budgets, just over 63% of programs reported a decrease in the travel budgets but unlike in years past, no programs reported an increase in their travel budget of more than 6%.
PART 2: ARCHITECTURE PROGRAM ENROLLMENT
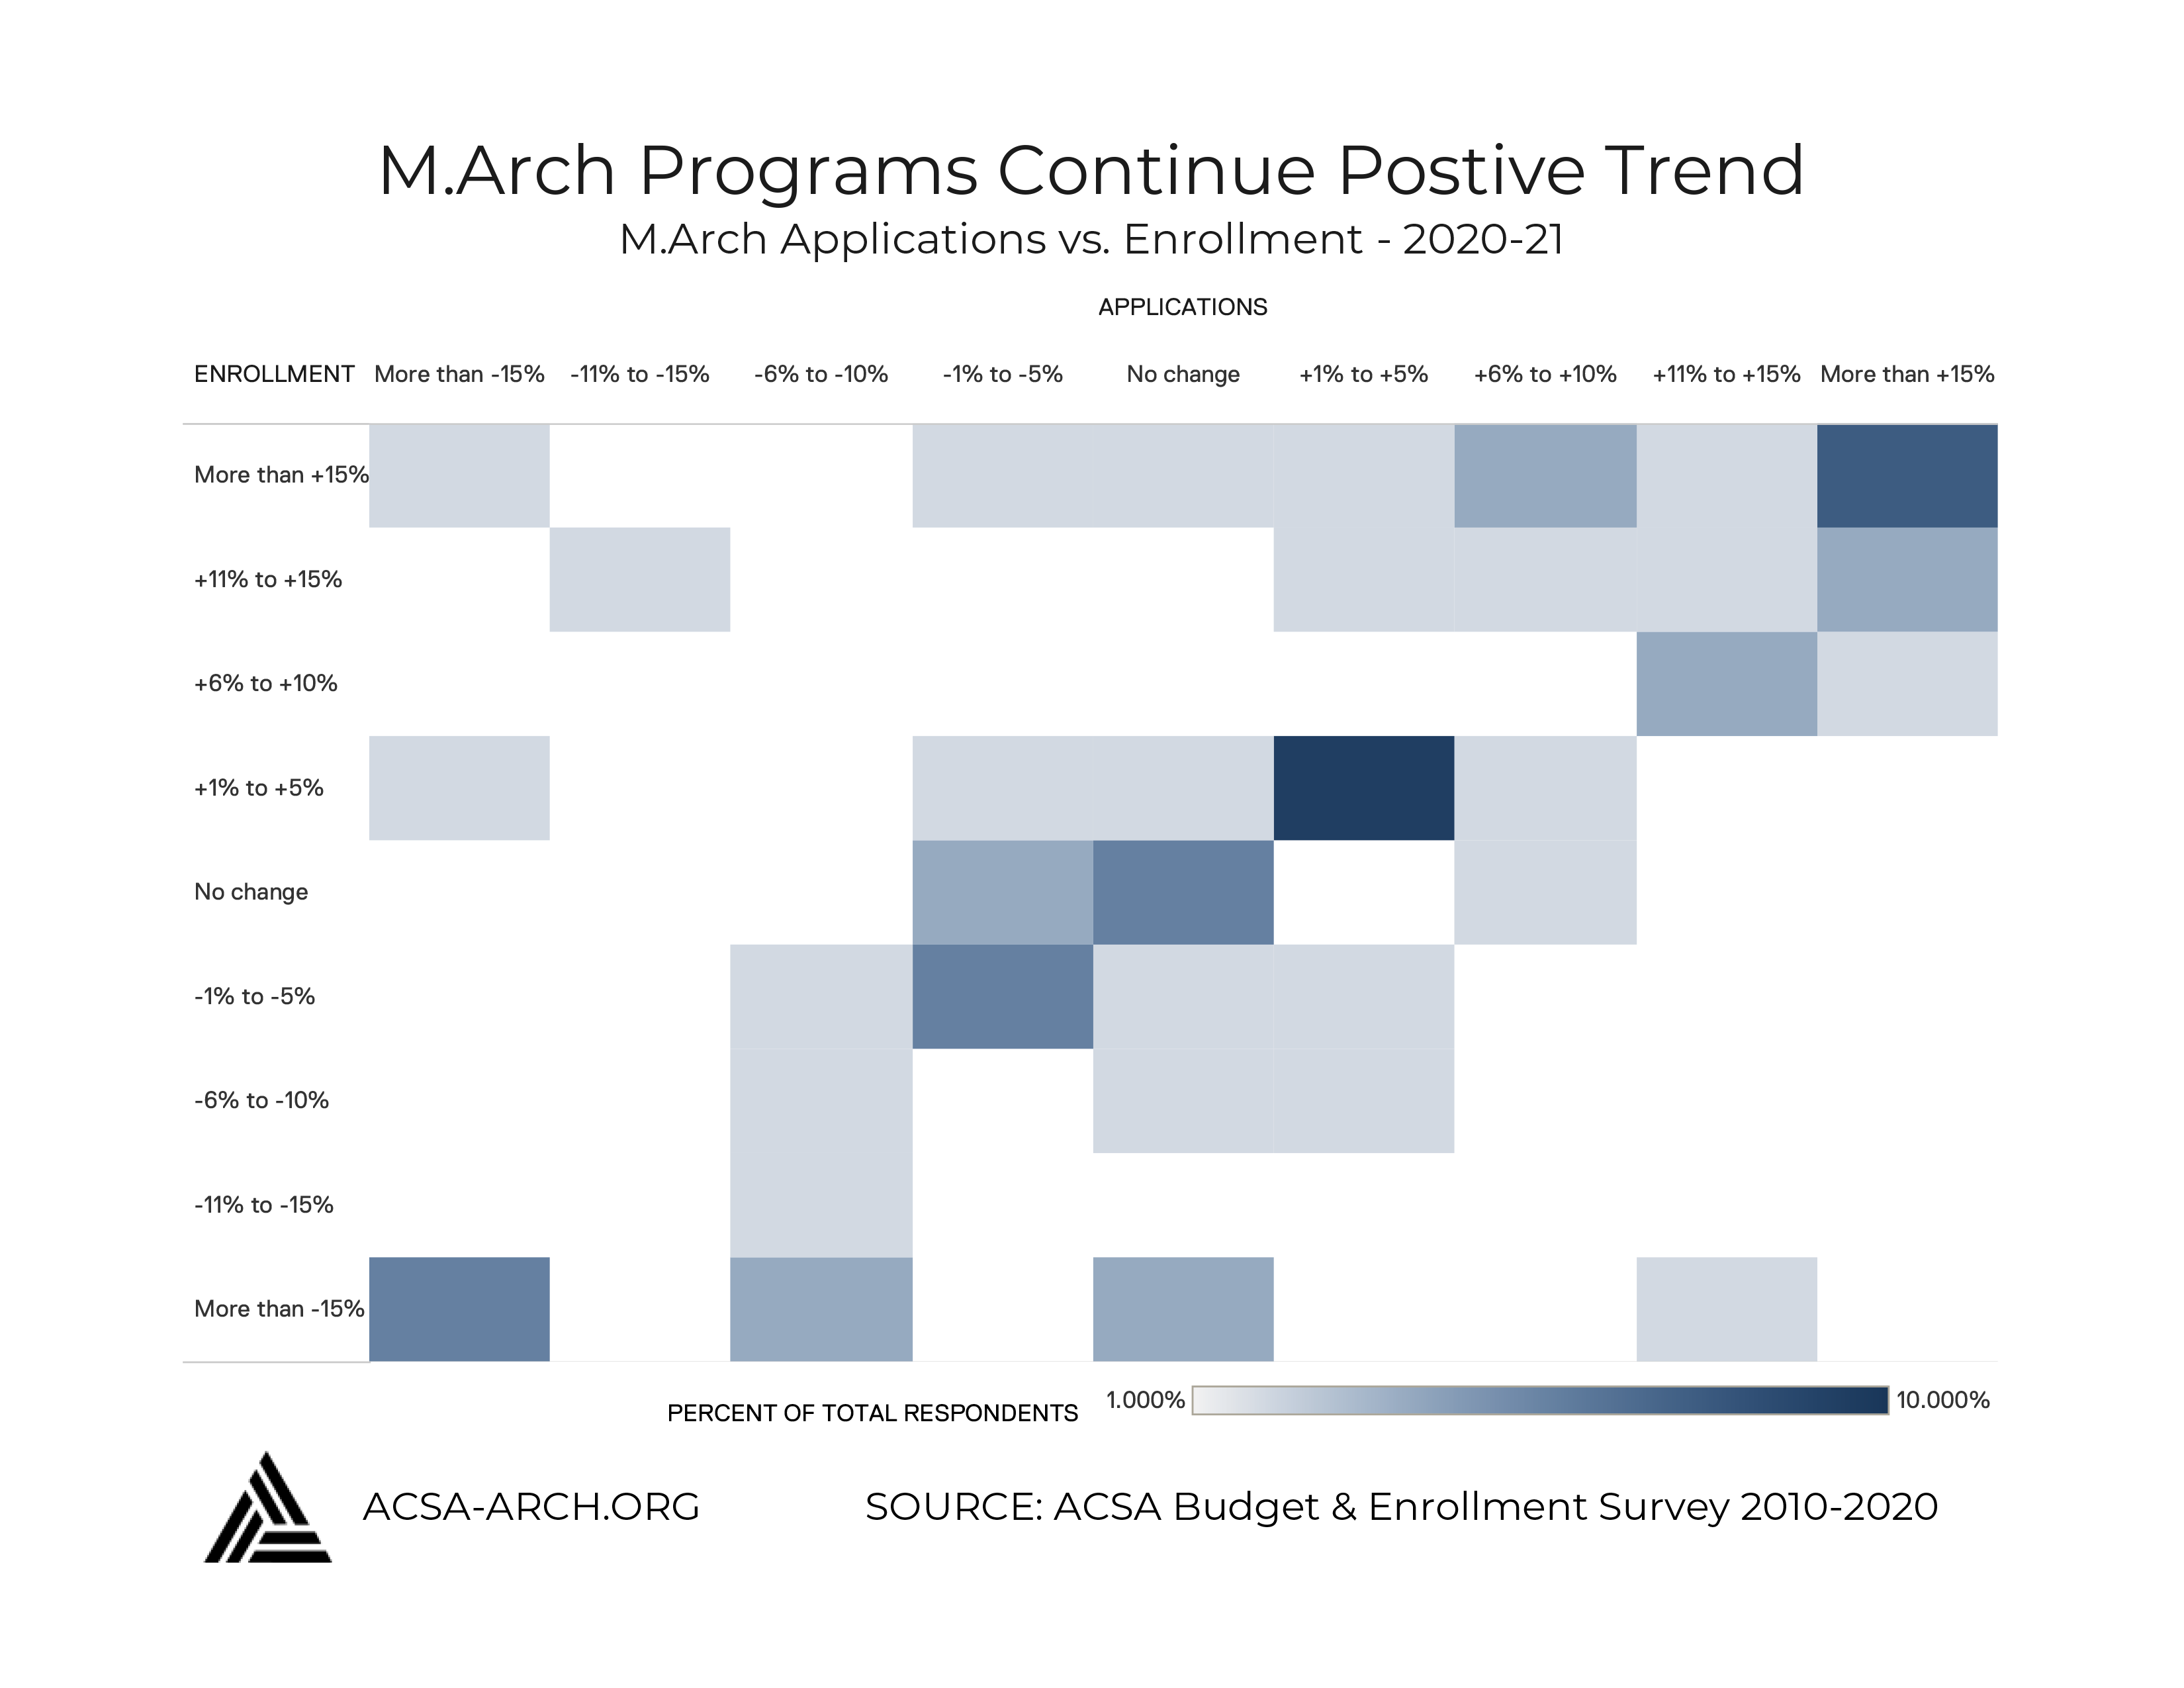
When examining the applications and enrollments for Pre-professional, B.Arch, M.Arch/D.Arch, and Post-professional degree programs, many of the results were inconclusive. However the M.Arch/D.Arch responses continued a positive trends as identified in past years. On the whole, as applications increased so did enrollment, and there appeared to be a grouping of programs that saw increase in both admission metrics.
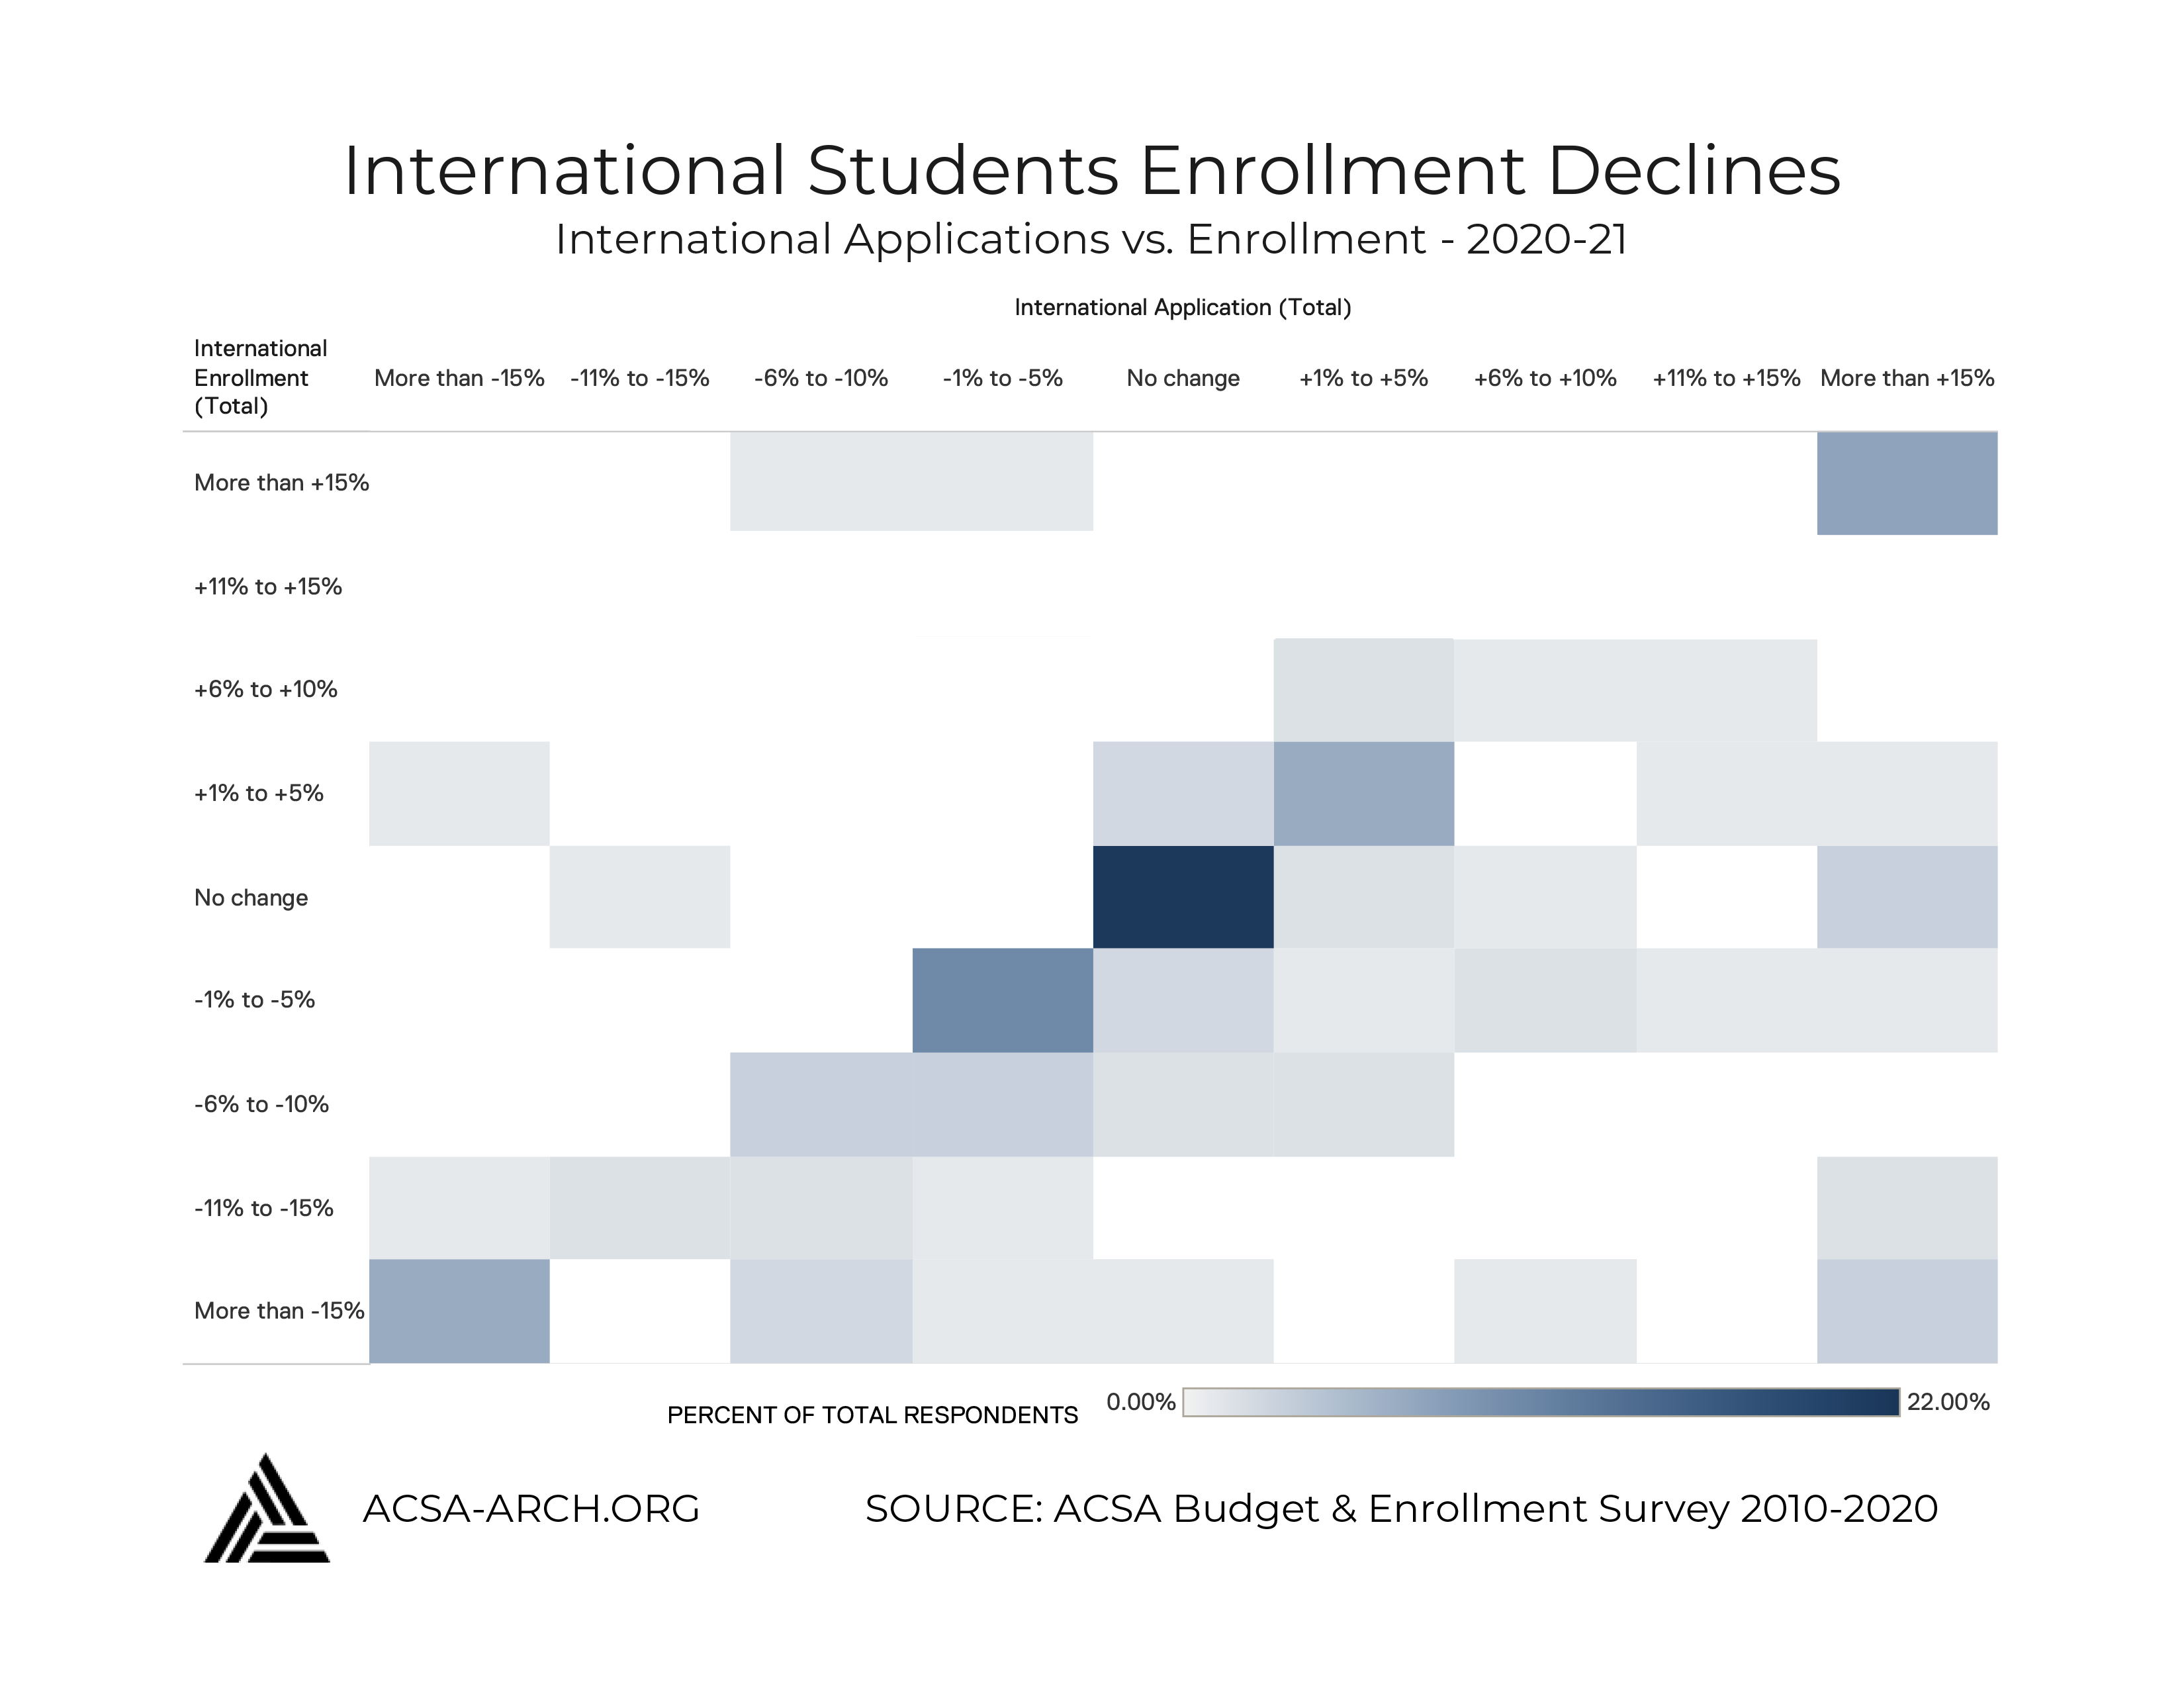
For the first time, this year, ACSA was able to collect and report on the admission of international students. Our research showed a larger percent of schools reporting a decline in the enrollment of international students. Confounding evidence of the restrictions on student visas make this finding fairly predictable.
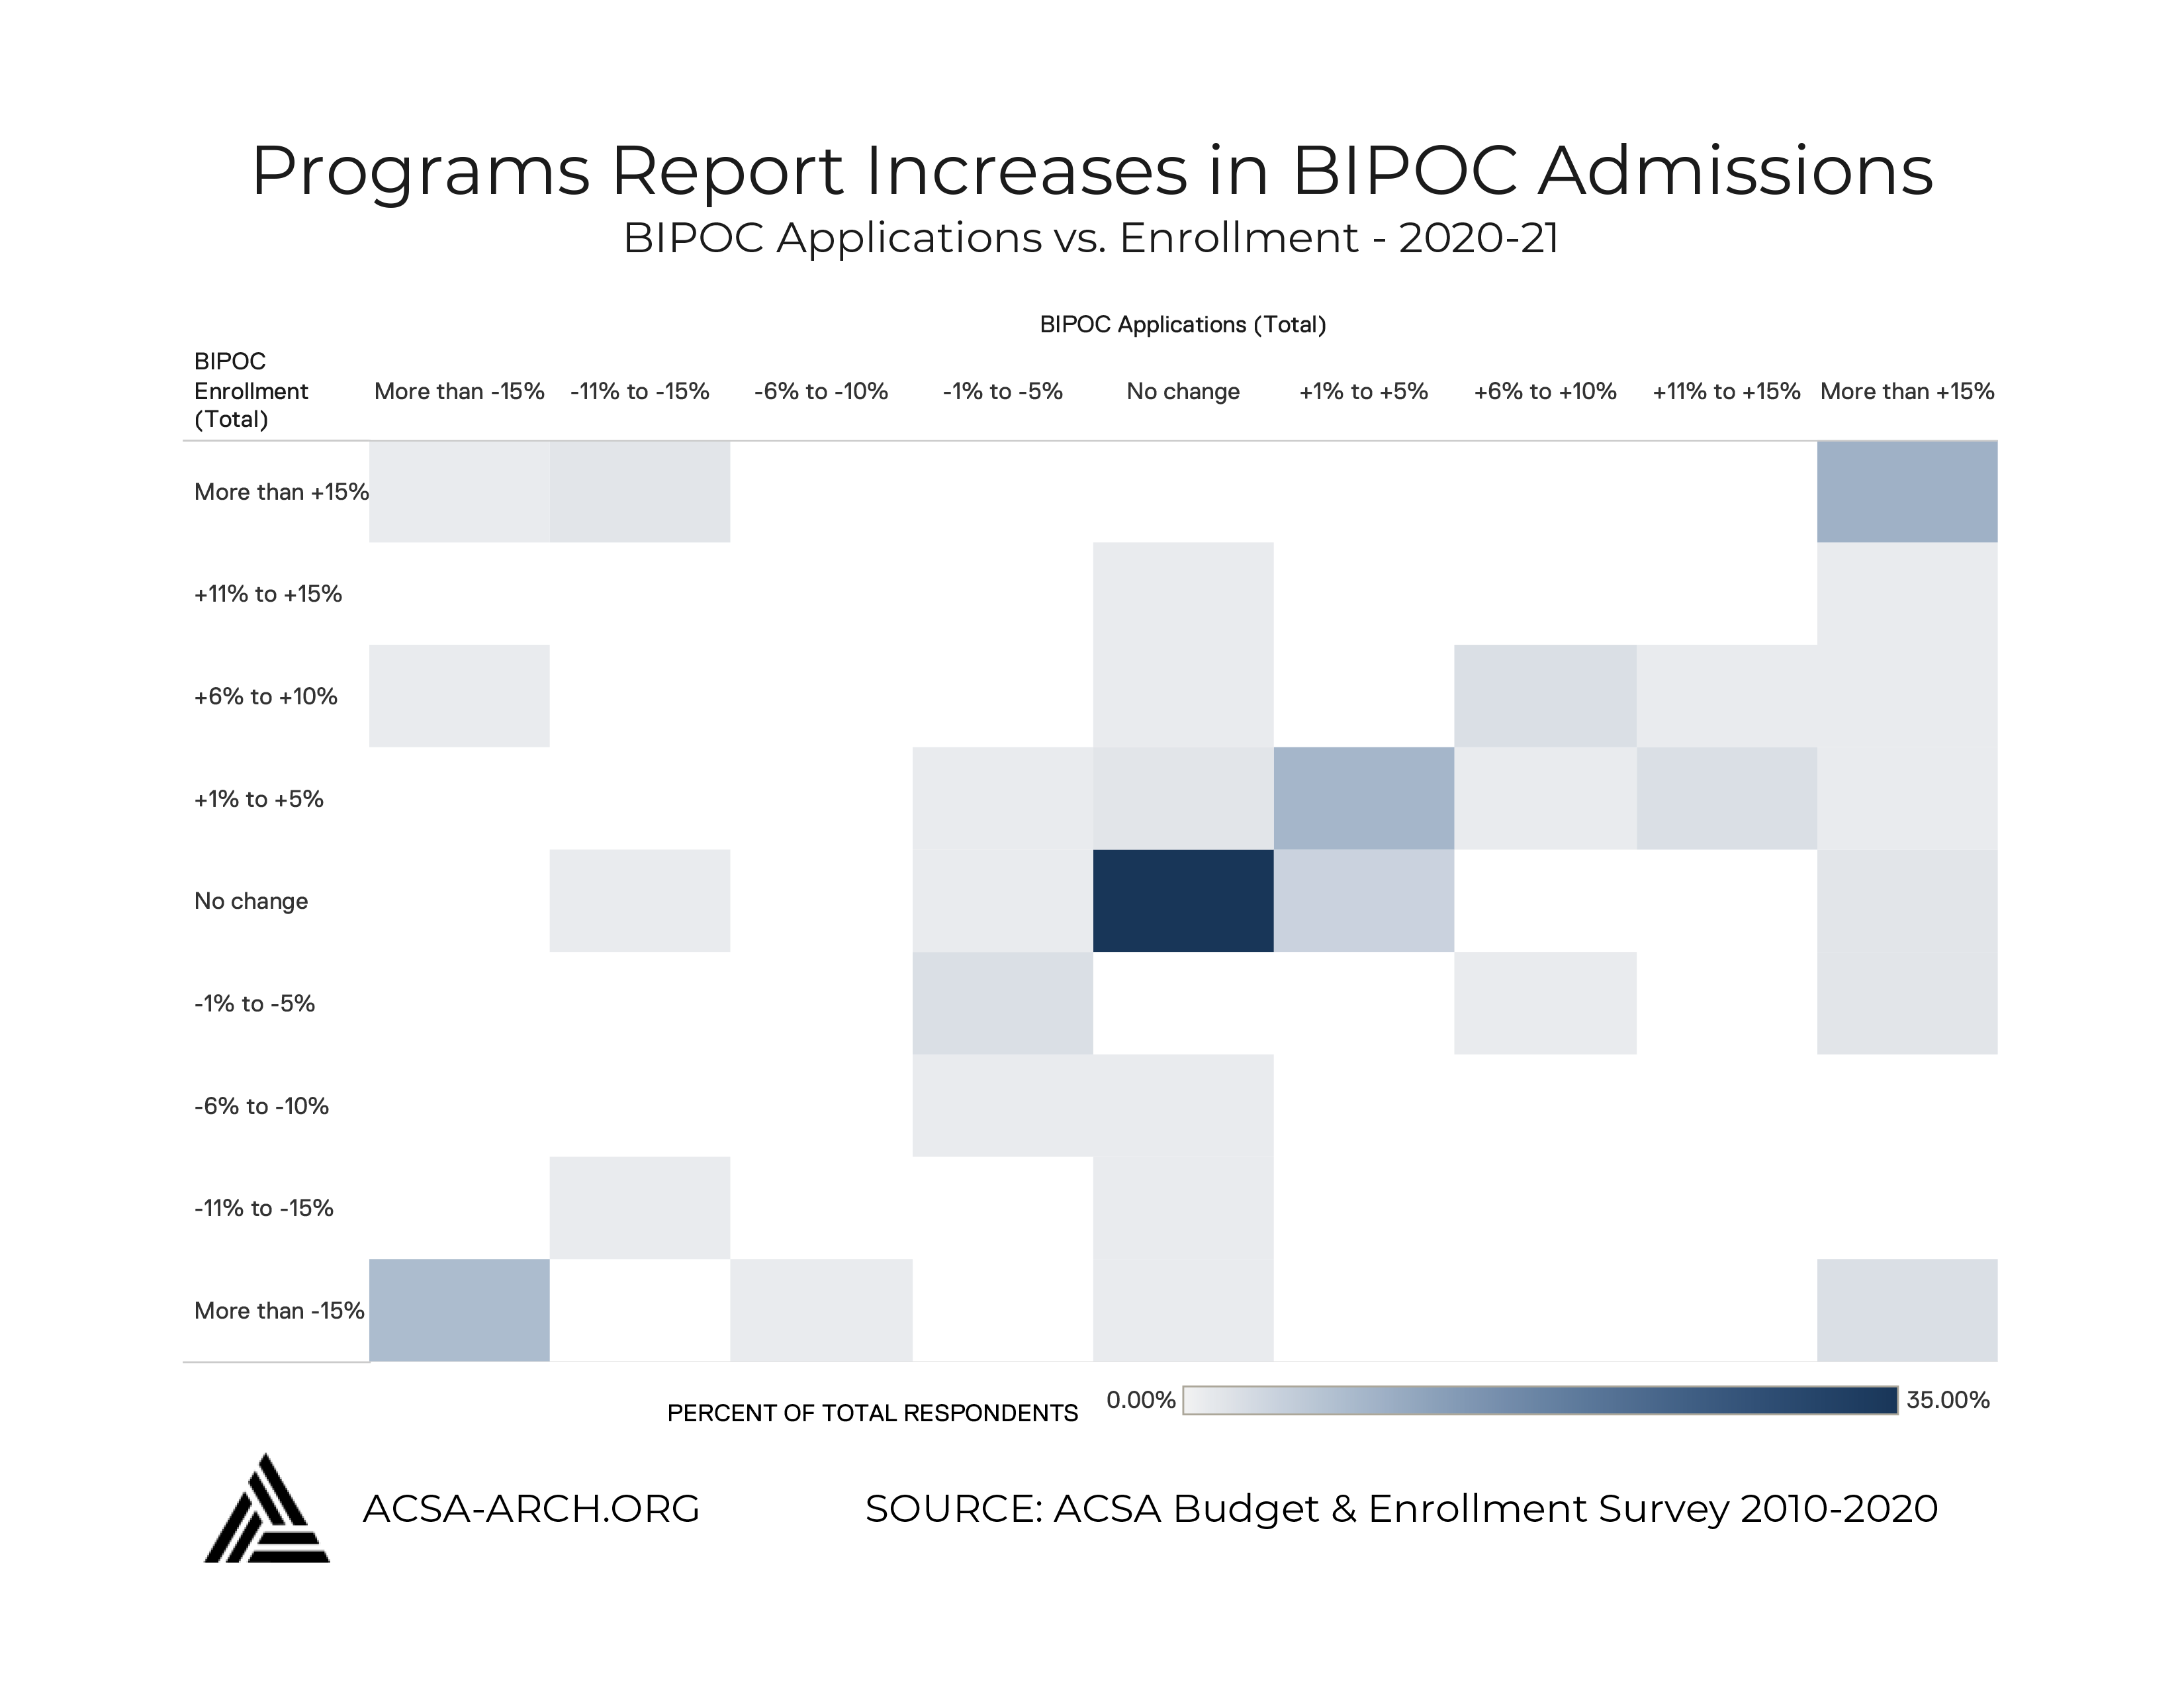
When evaluating this year’s changes in enrollment and applications, we also asked about BIPOC admissions. Of the participating programs, just over 1/3 reported no change in applications and enrollment. However, 28% of programs reported an increase in BIPOC applications and enrollment and when including those who saw a decrease in applications from BIPOC people, 36% of programs reported an increase in BIPOC enrollment. If this sample is indicative of the total population of schools, we should see NAAB’s Annual Report reflect the increased numbers of BIPOC students in the next few years.
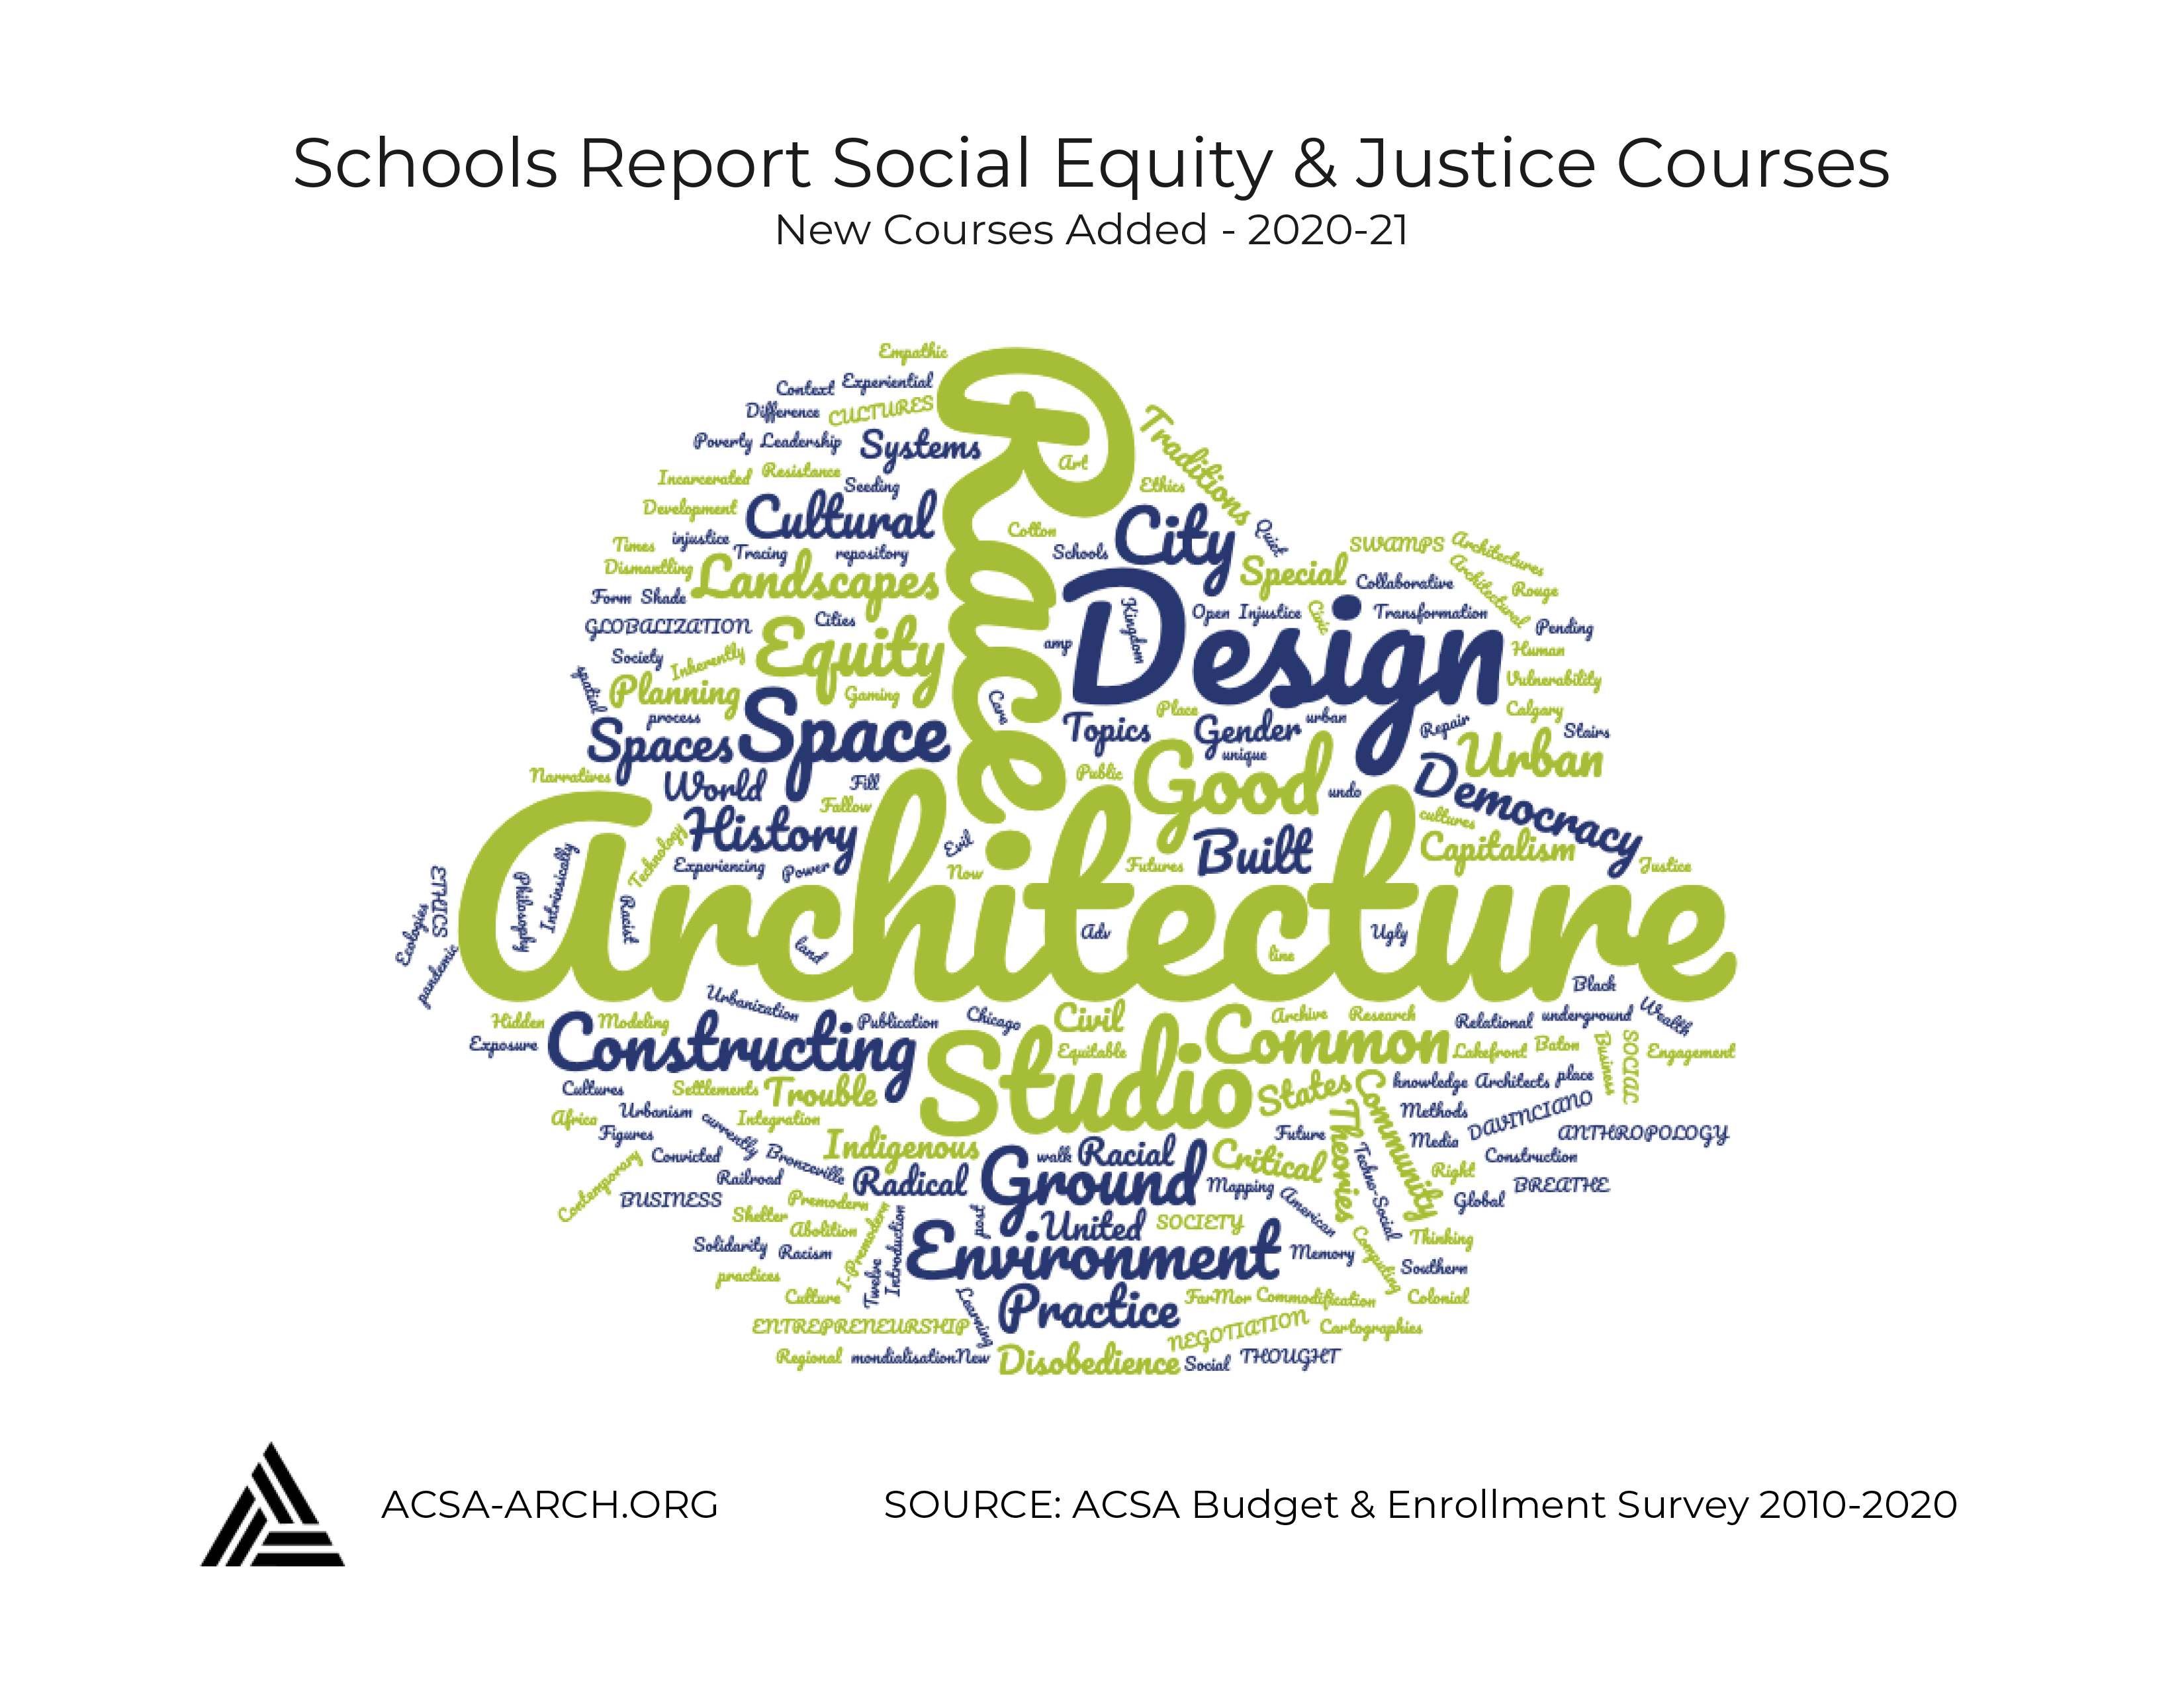
For the first time in the history of this survey’s 11 year span, we expanded the survey to include some frequently asked questions related to program changes. This year we asked about the new courses that were added to address social equity and justice as it relates to the built environment and the response showed a great deal of deliberate action. Program administrators reported 100 “new” courses that are being offered at ACSA schools across the globe. The word cloud shown is a result of course titles.
Find the full list of courses here:
PART 3: OTHER PROGRAM FINDINGS
Another commonly asked question we are able to answer this year is about studio class size. This graphic shows the average studio enrollment per studio instructor. This number varies widely by program but for most program types, the studio student:faculty ratio averages closely to the national average, 13:1, which is reported in the ACSA Institutional Data Report. Click the link below for more information on student:faculty ratios for all courses including a breakdown by region.
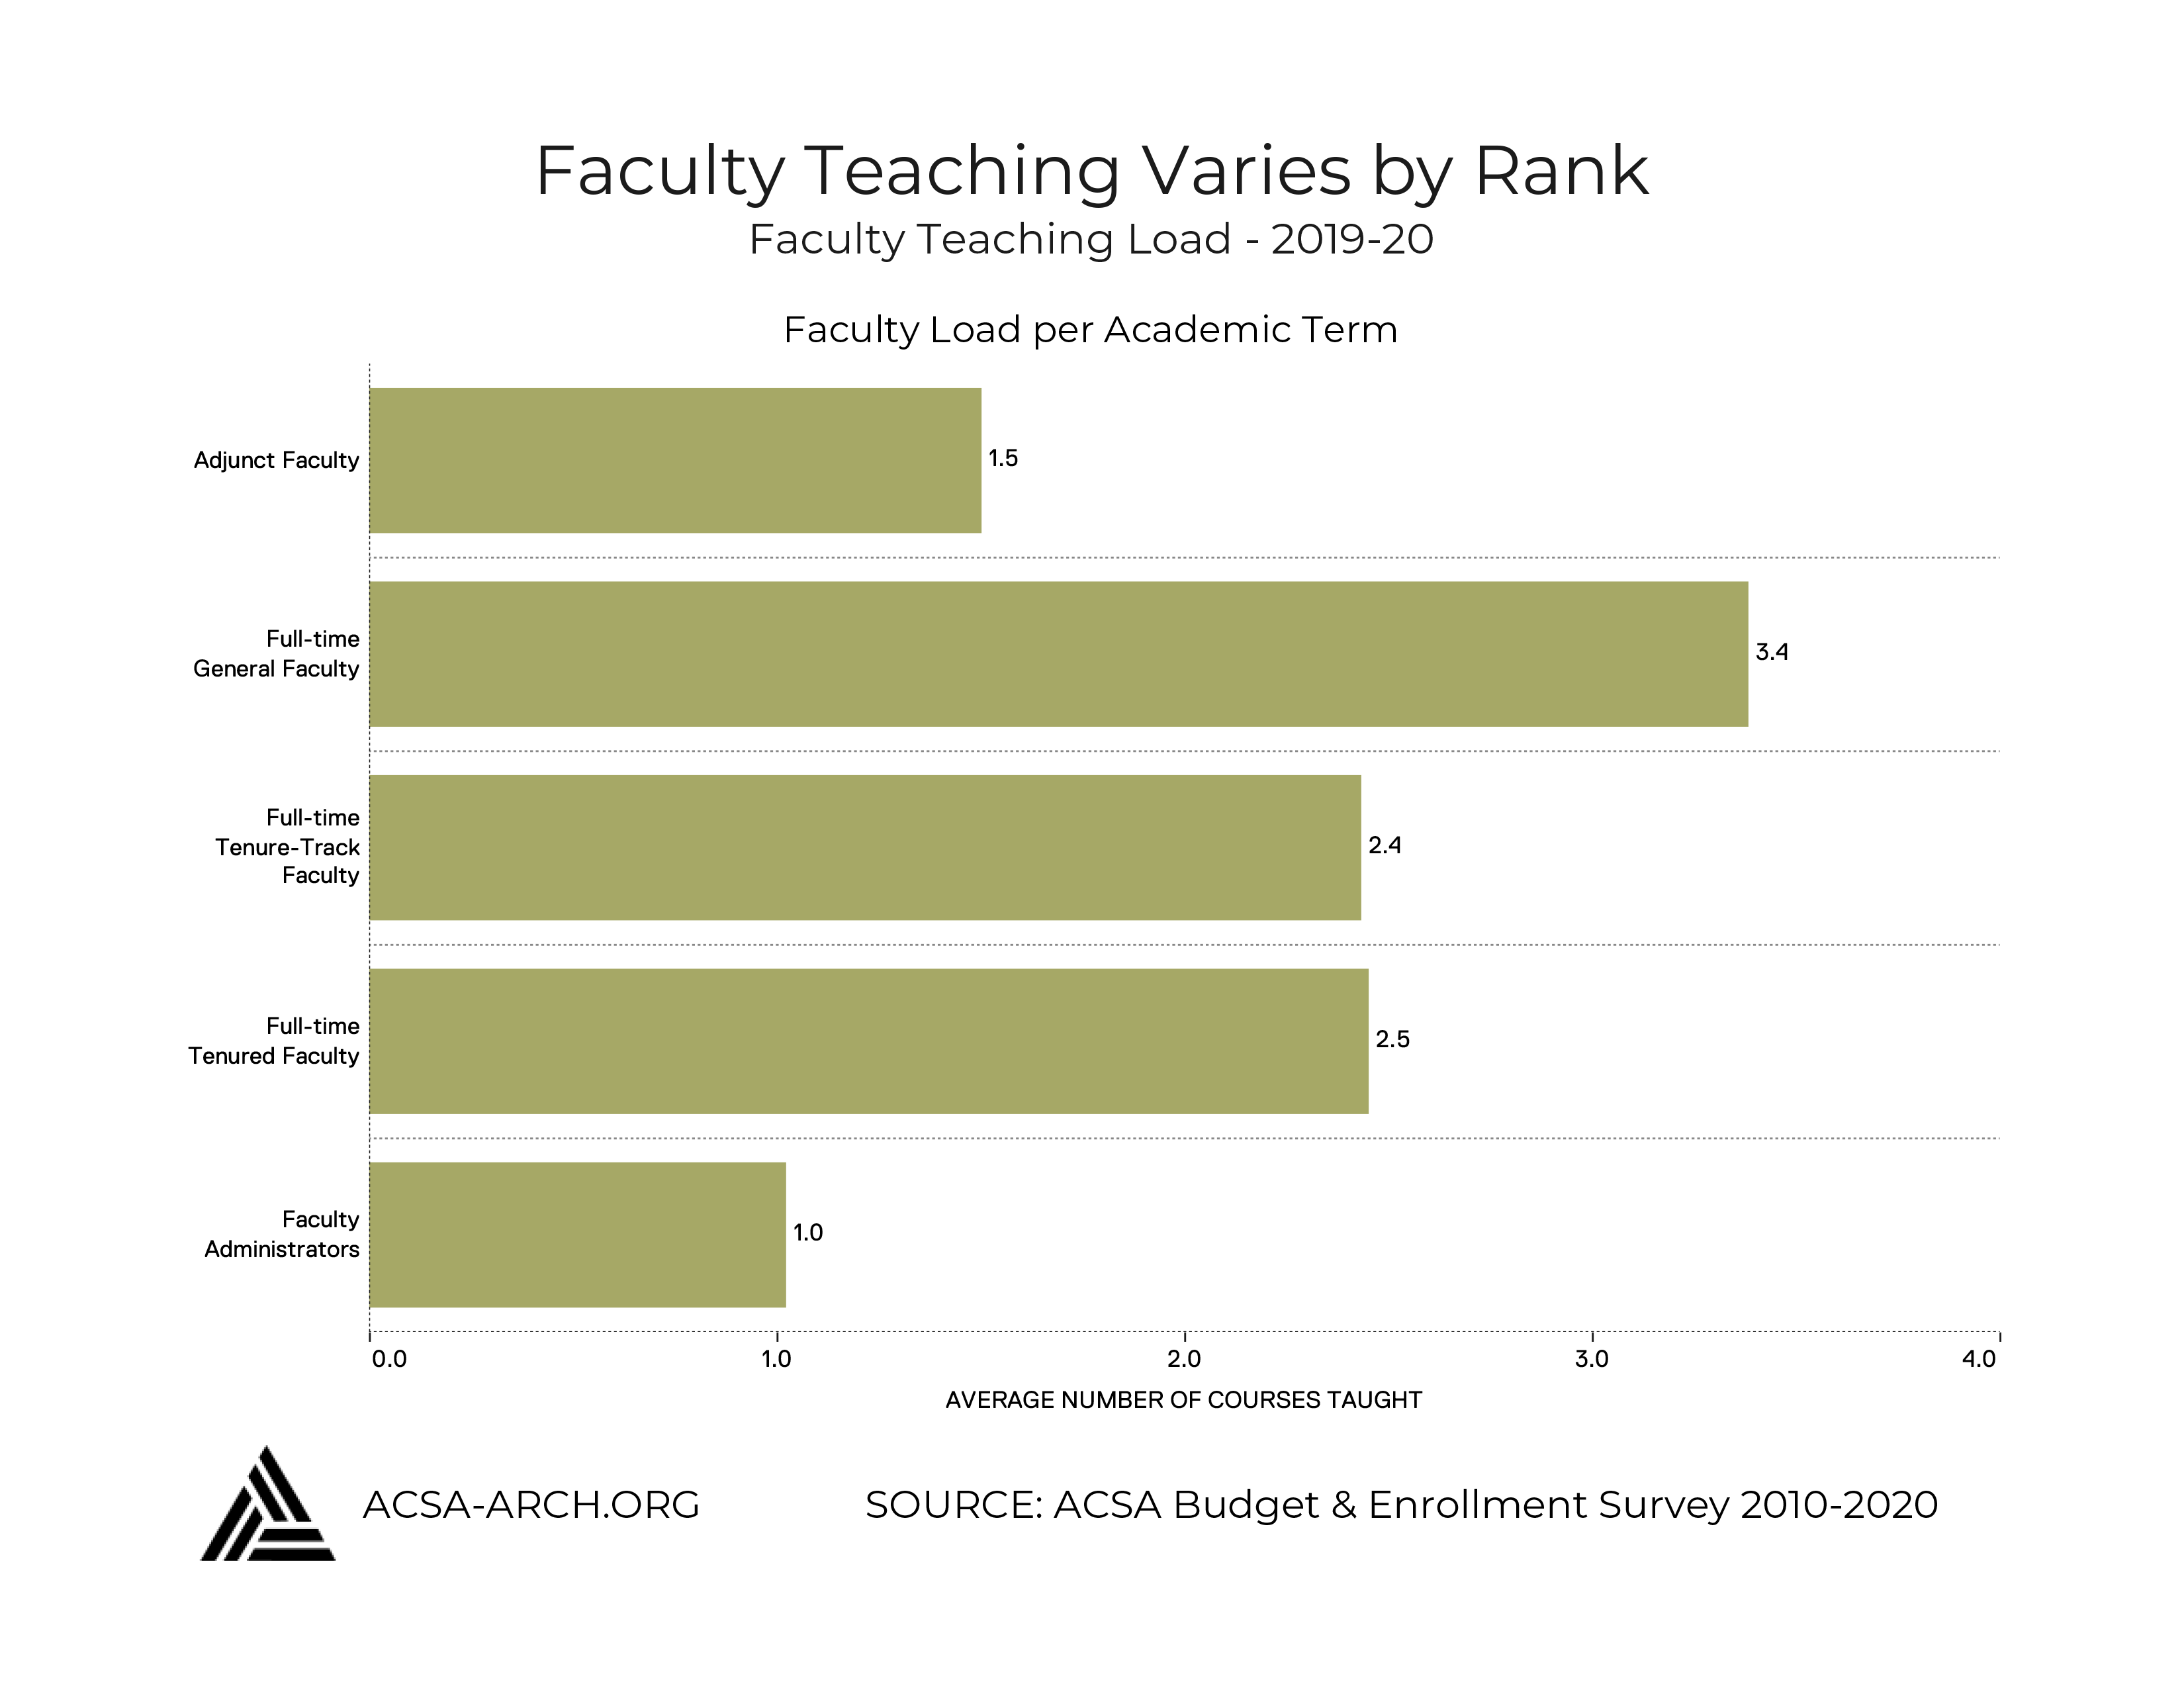
Our research on faculty teaching load varies by faculty type and indicates that faculty who are administrators are expected to have the lightest if any teaching load, followed by adjunct faculty teaching 1 or 2 courses, and tenured and tenured-track faculty teaching 2 or 3 courses each academic term. At this time, we do not have details on the number of credits equivalent to 2-3 courses but hope to be able to provide more detail in the future. For the purpose of this graphic, a studio course is counted as one course and many programs reported 9 credits and 2 classes as the expectation for tenured and tenured-track faculty each semester. Lastly, more research is needed to better understand the category of general faculty and how this category is situated at each institution.
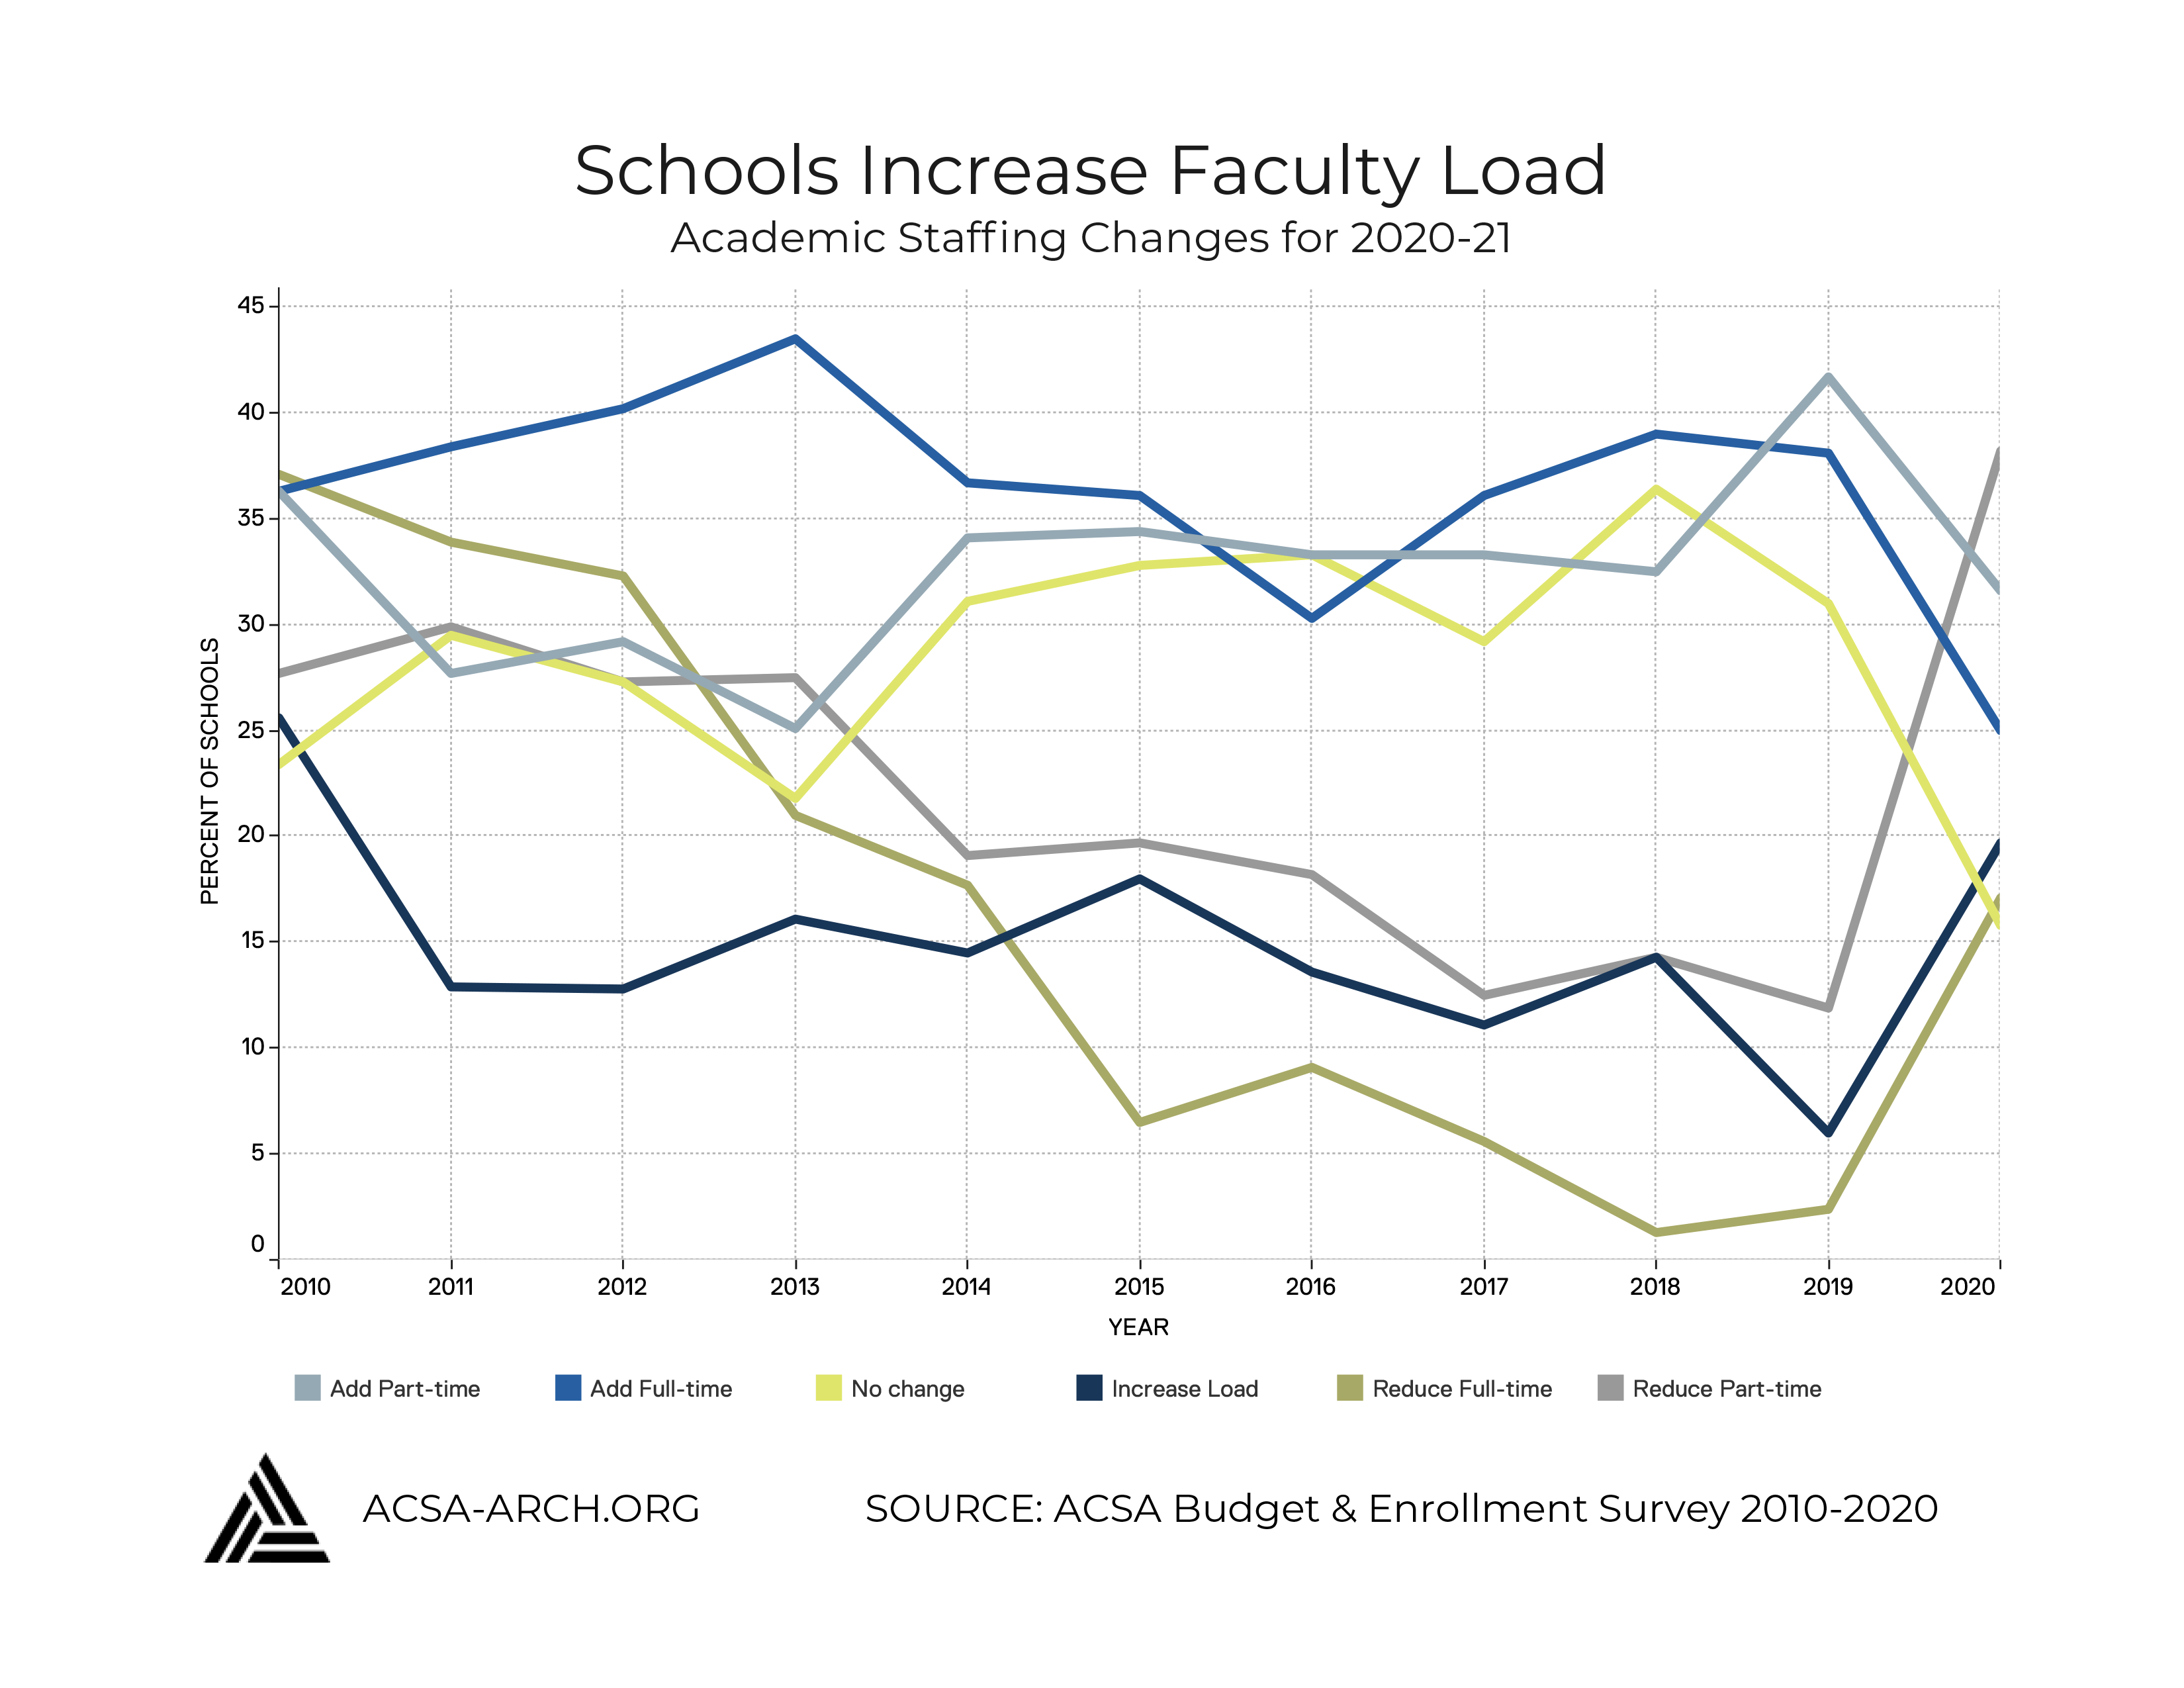
Finally, we asked program administrators about changes in faculty dynamics. Unfortunately, this year’s survey discovered a decrease in schools hiring full-time and part-time faculty. Conversely, our study shows an increased number of programs reducing full-time and part-time faculty and increasing faculty teaching load. Qualitative research done with administrators tells us that, as a result of the global health pandemic, the vast majority of schools had hiring freezes in place for the better part of the year. However, we know, by the number of job ads recently posted on the ACSA website, that this is changing as we approach the end of the year.
ACSA would like to thank all of the schools that shared their data in regards to budget, enrollment, applications and academic staffing. School participation is integral in our quest to provide a full and accurate picture of these dynamics across architecture schools.
Questions
Kendall Nicholson
Director of Research and Information
202-785-2324
knicholson@acsa-arch.org

 Study Architecture
  ProPEL