Lian Chikako Chang, ACSA Director of Research + Information
October 2014
The farther up you look in the world of architecture, the fewer women you see. In this chart, we’ve rounded up some common and publicly available metrics behind this claim. Like thousands of aspiring architects, we’ll start at the bottom and work our way up—while also pausing on the way to consider what these measures mean.
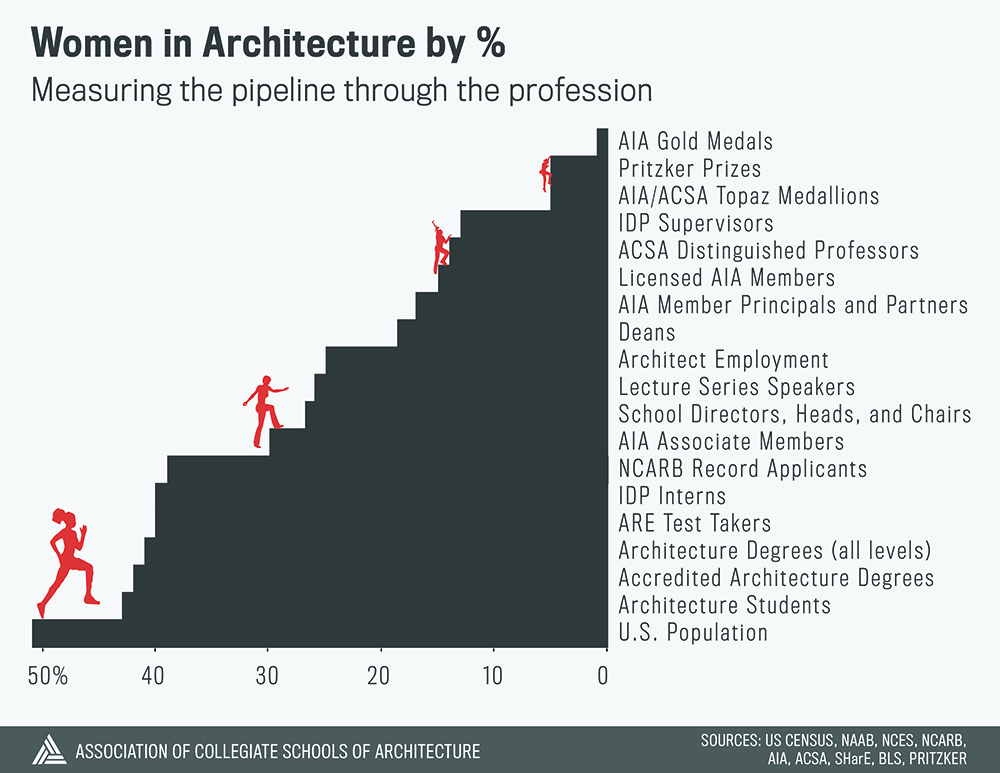

U.S. Population: The Census Bureau reports that in 2013, 51% of the 316 million estimated people residing in the United States were women.
Architecture Students: In its most recent annual report (2013), the National Architectural Accrediting Board (NAAB) indicates that 43% of a total of 25,958 enrolled students in NAAB-accredited architecture programs (B.Arch, M.Arch, and D.Arch) in 2012-13 were female. Although the representation of women in architecture schools has been steadily growing, women still represent significantly fewer than 50% at this early stage.

Accredited Architecture Degrees: NAAB’s most recent Report on Accreditation in Architecture also shows that in 2012-13, 42% of a total of 6,347 accredited architecture degrees were awarded to women. Because a NAAB-accredited degree is a requirement for licensure in most states, earning this degree is a clear and measurable moment in the “pipeline” into the profession.
Architecture Degrees (all levels): Based on data from the National Center for Education Statistics (NCES), 41% of a total of 10,893 degrees architecture degrees in 2012-13 were awarded to women. Whereas the above NAAB data count only the accredited degrees that are generally required for licensure, NCES does not distinguish between NAAB-accredited and non-professional architecture degrees and instead counts both. Either way, women make up 41%–42% of recent architecture graduates, and this number was relatively consistent across all levels from Associate’s up to Doctoral degrees.

ARE Test Takers: In 2013, 40% of those actively taking the various divisions of the Architect Registration Examination as a step towards licensure were women, according to NCARB.
IDP Interns: In addition to taking the ARE, candidates for licensure must gain work experience through the Intern Development Program (IDP). NCARB by the Numbers, the report by the National Council of Architectural Registration Boards (NCARB), reports that in 2013, 40% of those actively submitting hours were women.
These two data points from NCARB combined with the education statistics from NCES and NAAB are a sign these early career stages aren’t pushing women out (or at least, not any faster than they push out men). That said, flexibility in IDP in terms of experience settings, categories, and beginning IDP before graduation means that this metric actually counts people with a range of situations and career stages, and this can get complicated. For example, the AIA’s 2005 report on diversity noted that nearly twice as many men as women completed IDP in fewer than three years (20% versus 11%) and more women completed IDP in 4 to 6 years (46% versus 38%). If this remains true today, the relatively robust number of female IDP interns in any given year may be somewhat buoyed up by those who remain at this stage while their male peers have already moved on.
NCARB Record Applicants: Applying for an NCARB record is a first step for students or graduates to complete IDP or the ARE. So this is a good indication of intention to become a licensed architect and a solid measure of the pipeline into the profession, since each person should generally only pass this milestone once, to be counted in one year only. In 2013, 39% of NCARB record applicants were women.
AIA Associate Members: The 2014 Foresight Report from the American Institute of Architects (AIA) indicates that in 2011, 30% of its associate members were women. This membership category is open to anyone meeting “one of the following criteria: professional degree in architecture; currently work[ing] under the supervision of an architect; currently enrolled in the Intern Development Program (IDP) and working toward licensure; or faculty member in a university program in architecture.” So although this number is an inexact measure of the “pipeline” through the profession, this voluntary membership is a sign of identification and intentions.
We’ve talked about a “pipeline” into the profession a few times, but what does it mean? This idea is often used to describe people of a given demographic advancing from one stage to the next over the course of their careers. When disproportionate numbers stall or drop out at various points along the way, this is described in terms of a “leaky” pipeline.
Although such a mechanical analogy is necessarily reductive, it can help us think at a macro scale. For example, are there few women at the top of the profession due to generational reasons, because there are more women “coming down the pipeline” who just need a few more years to arrive? Or are there specific, measurable points in the pipeline that remain leaky today? Measuring this isn’t easy, as the AIA’s 2005 report on diversity suggests, but we’re going to try. So brace yourselves, because it’s about to get messy as we keep climbing up this chart.
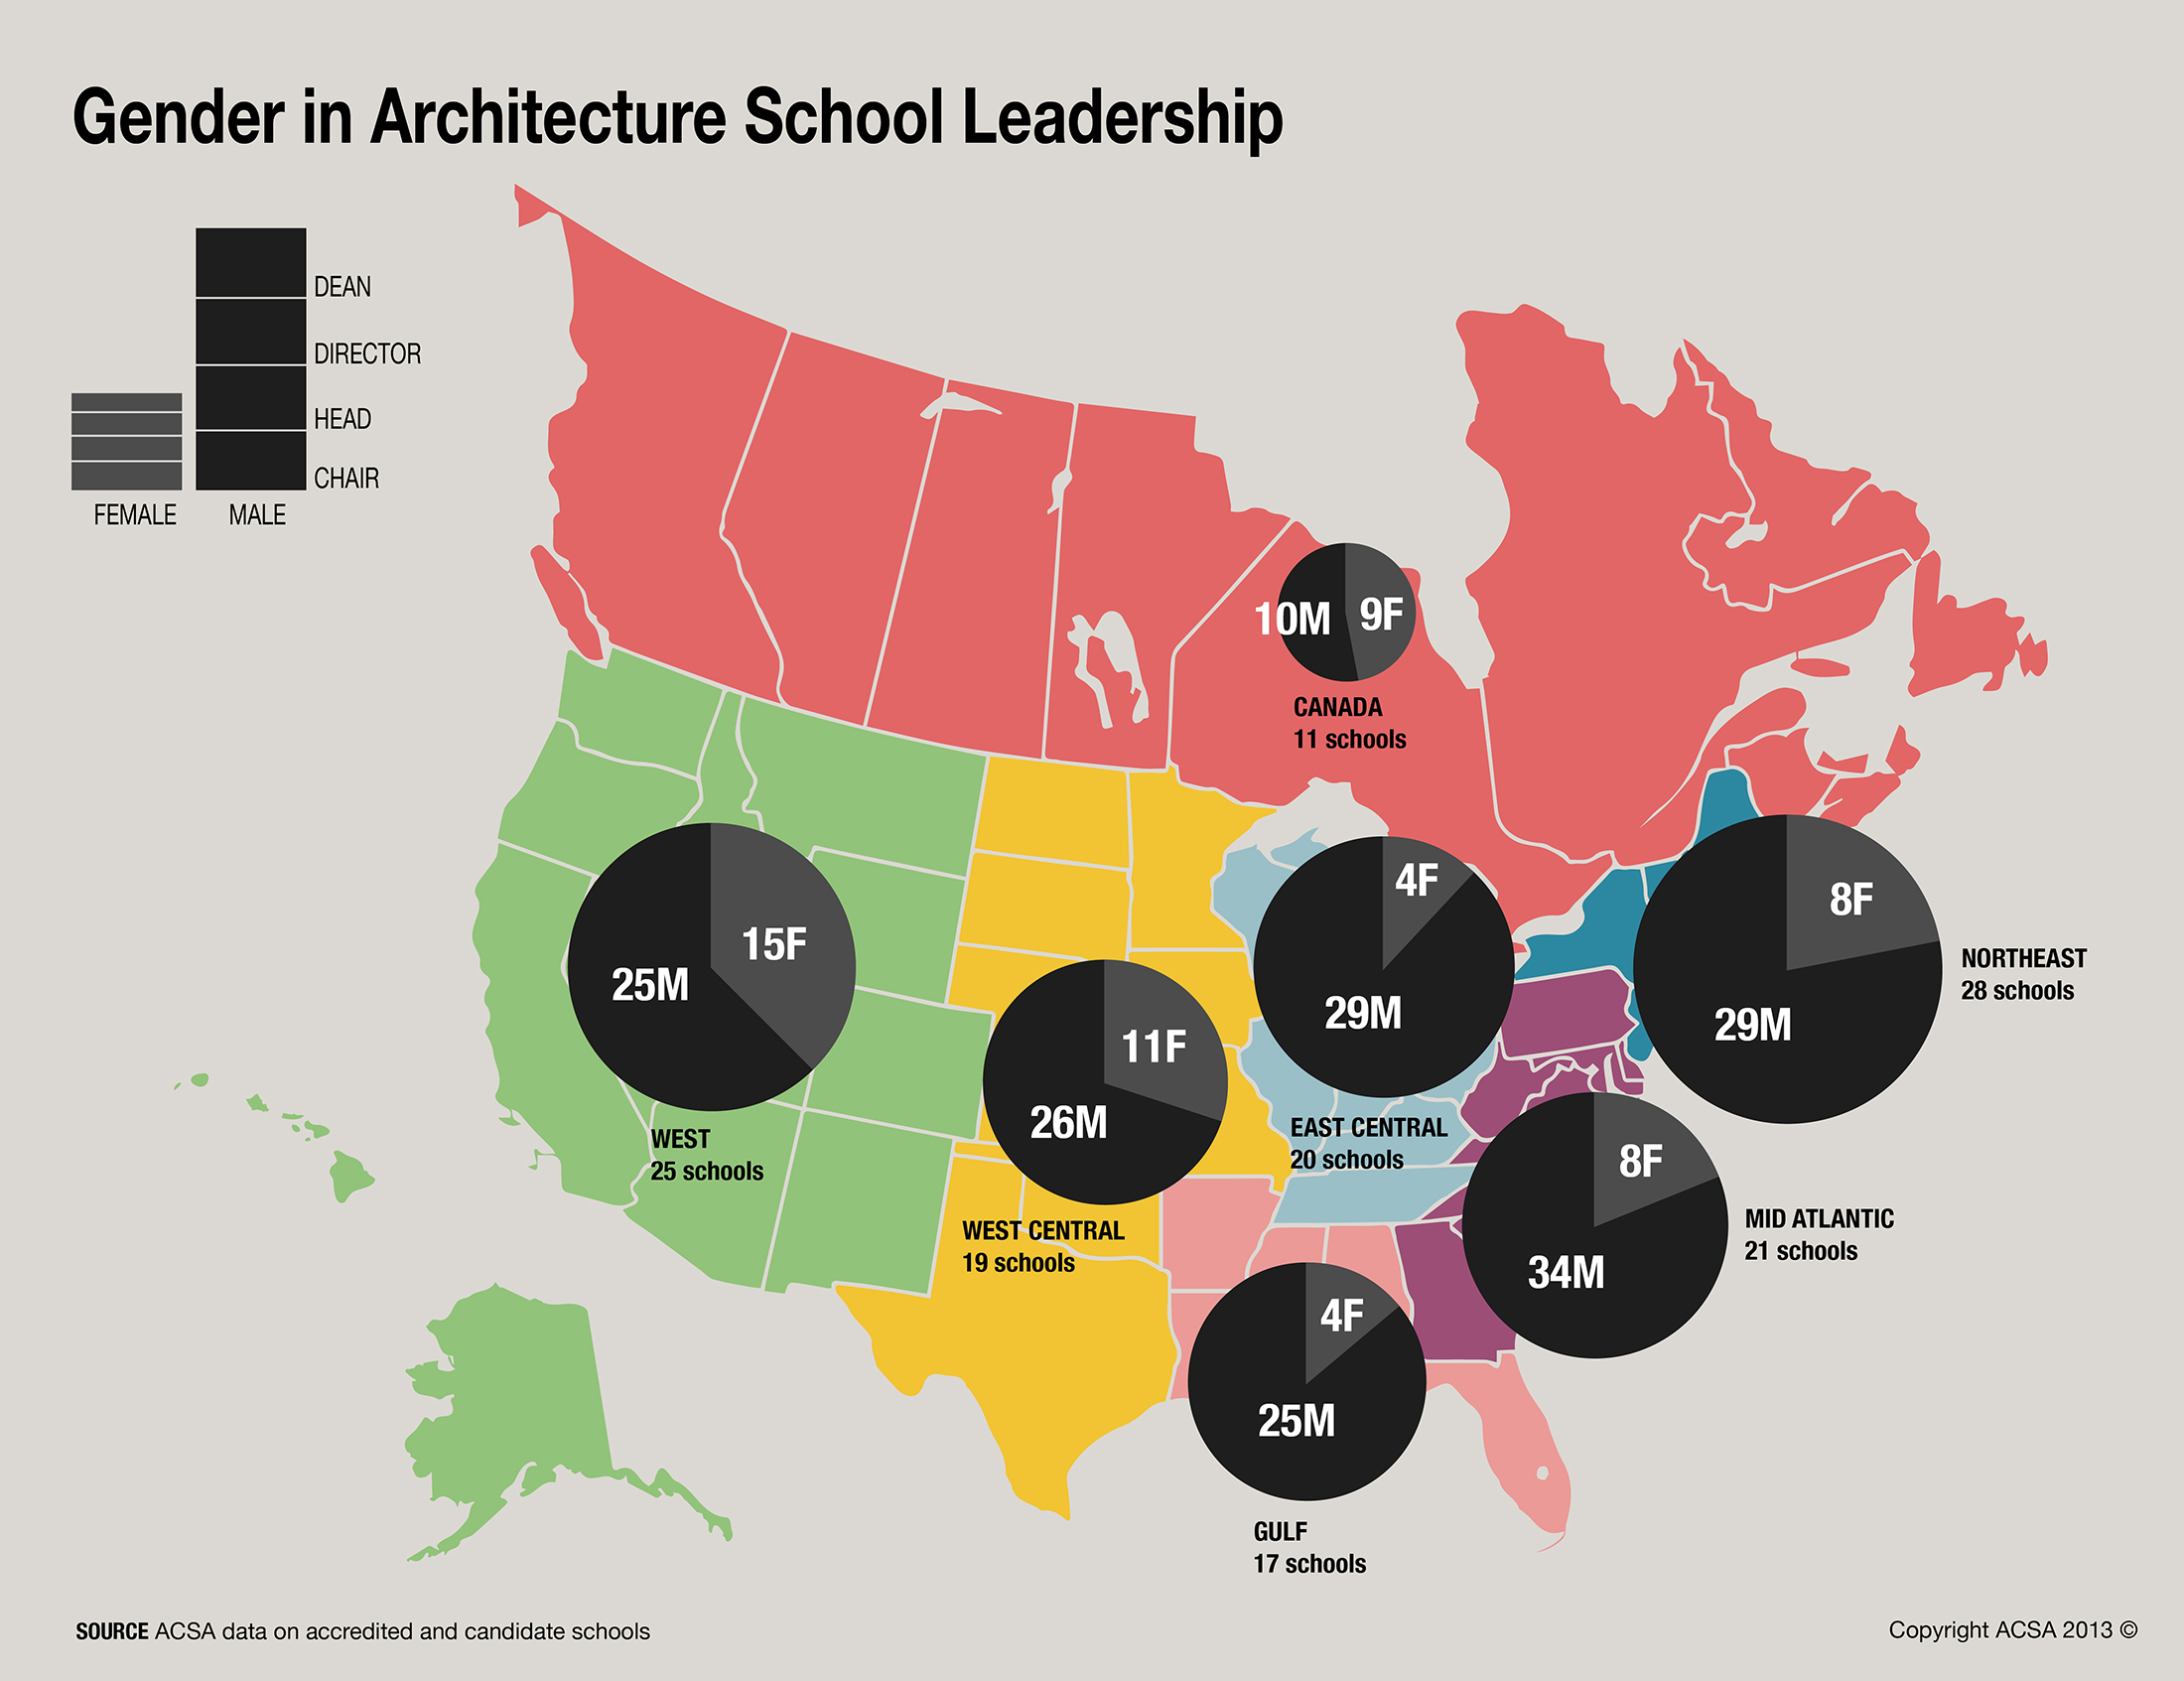

School Directors, Heads, and Chairs: Based on our data at the Association of Collegiate Schools of Architecture (ACSA), but omitting the more gender-balanced Canadian schools, we find that in 2013, 27% of 140 directors, heads, and chairs at U.S. architecture schools with accredited programs were female. [Note: a version of this slide updated in 2014 is available here.
School Lecturers: Lori Brown and Nina Freedman of SHarE surveyed 73 architecture school lecture series in the spring of 2013, and found that 26% of 510 scheduled lectures were by women. Further data would be interesting here—for example, how many individual men and women were represented among those 510 lectures, and how many of the most frequent lecturers were women?

Architect Employment: The Bureau of Labor Statistics (BLS) reports that in 2013, 25% of the 193,000 people working as “architects, except naval” in the United States were women. This is a powerful but complicated statistic. The BLS counts those who are employed in any industry in an “architects, except naval” role. So this includes those working as architects for the federal government or for developers, but not those employed as craftspeople, university instructors, urban designers, writers and critics, or other roles in which a person may identify with architecture while not practicing it in the strict sense. It includes the self-employed and those on leave, but not those who are unemployed. Importantly, the BLS does not distinguish between licensed and non-licensed practitioners (“apprentices and trainees”). If we’re measuring different points along our pipeline, this metric refers to points that are potentially before, during, and after—or even separate and parallel—to the steps towards licensure described above. By comparison, NCARB reports that there were 105,847 registered architects in the United States in 2012-13, so the BLS figure of 193,000 counts many “intern architects” who are pursuing licensure, as well as those who are not working towards a license.

Deans: By ACSA’s count, 19% of 86 deans at U.S. architecture schools with accredited programs in 2013 were female.
AIA Member Principals and Partners: The AIA’s 2014 Foresight Report indicates that in 2011, 17% of AIA members who were firm principals and partners were women.
Licensed AIA Members: The AIA knows which of its members have a professional license, and in their 2014 Foresight Report they reported that 15% of their licensed members are women. At first glance, it seems strange that this number is lower than the 17% for AIA members who are firm principals and partners. Is this because firm leaders aren’t necessarily licensed? Or because, once licensed, women become principals and partners at slightly higher rates than men? It would also be interesting to quantify whether women are more likely to become sole practitioners or move up the ranks in smaller firms.

ACSA Distinguished Professors: Starting in 1984-85, the ACSA has recognized a handful of living individuals for their sustained achievements in advancing architectural education through teaching, design, scholarship, research, or service. Chosen by a committee based on nominations, 14% (or 17) of 122 recipients over 29 years have been women.
IDP Supervisors: NCARB by the Numbers reports that 13% of IDP Supervisors—firm managers who supervise and review the work of intern architects submitting IDP hours, and who in most cases must be licensed architects—are women.
AIA/ACSA Topaz Medallions: One Topaz Medallion is awarded each year to a living person who has influenced “a long line of students” over at least a decade primarily spent in North American architectural education. Based on nominations and selected by a jury, 5% (or 2) of 39 recipients since 1976 have been women: Denise Scott Brown in 1996 and Adèle Naudé Santos in 2009.
Pritzker Prizes: Known as the “Nobel Prize of architecture,” the Pritzker is each year awarded to a single living practicing architect (or occasionally a pair) in recognition of significant contributions to humanity and the built environment through built works of architecture. Decided by a jury, based on nominations solicited from notable people in the field, 5% (or 2) of 39 Pritzker Prize recipients since 1979 have been women. This includes Zaha Hadid in 2004, and Kazuyo Sejima in 2010, alongside her male partner Ryue Nishizawa.
AIA Gold Medals: This highest honor that the AIA bestows upon an individual or pair recognizes “a significant body of work of lasting influence,” based on nominations and reviewed by a jury. Of 69 medals since 1907, one has been awarded to a woman (Julia Morgan, posthumously in 2014), representing 1% of the total.
All of this makes it clear that as you look higher in the architectural profession or in academia, you see fewer women. Even in architecture school today, fewer than 50% of students are women, and the numbers start dropping off sharply, from around 40% to around 25% and fewer when we start looking at practice and higher levels in the profession and academia.
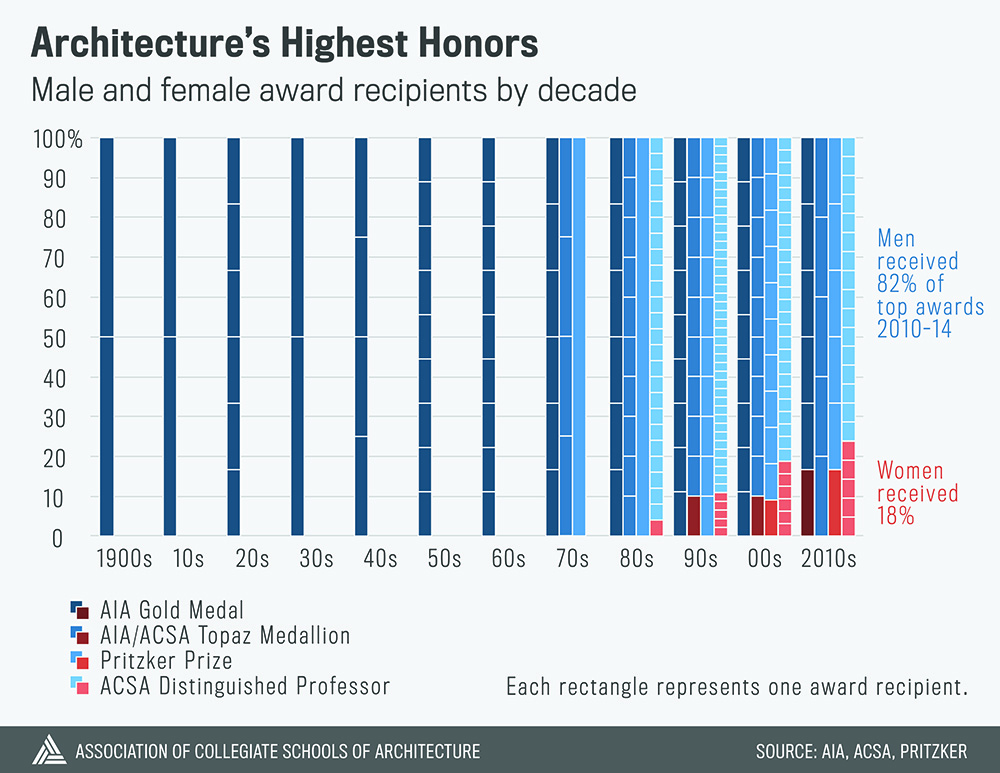
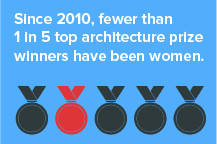
You might be thinking that this data on prize winners, going back several decades, don’t necessarily represent the situation for the current generation of women. And you’d be right. Breaking down the gender split among the winners of top awards in practice and academia by decade, in the above chart, we can see that women have been increasingly recognized since the 1980s. But, significantly, even in the most recent years since 2010, fewer than one in five of these awards have gone to women.
How can we understand how the situation for women in architecture is changing over time? If there’s one thing that going through these data sources makes clear, it’s that each has its own caveats and peculiarities that make it not perfectly comparable to the others in the strictest sense. But these are the data we have for now, and acknowledging their imperfections, they’re still revealing. The last chart, below, shows time series data for the metrics we have, going back as far as we have them.
Starting at the top with the green and blue lines, we can see that the proportion of women among NAAB accredited degree earners has historically trailed the proportion of women among enrolled students, but that over the past five years these two lines have converged. In other words, women are graduating with accredited degrees at basically the same rate they’re enrolling, indicating that there is no longer either a gender-based achievement gap or pipeline delay within architecture school.
The purple line shows the increasing participation of women among NCARB Record applicants, based on a chart recently published by NCARB. In 1985, women represented over 25% of architecture students but fewer than 10% of NCARB Record applicants. If this gap reflected only the pipeline delay, or time that it would take for these women to progress to further stages at the same rate as their male peers, we would see the proportion of female NCARB Record applicants exceed 25% a few years after 1985—not fifteen years later, in 2000. So that is an example of a “leaky pipeline,” where women were dropping out of the profession at higher rates than men.
In recent years, however, the purple line has nearly reached 40%, indicating that female students and graduates are about as likely to take this step towards licensure as their male colleagues. In other words, the “leaky pipeline” into the profession is no longer that leaky for the stretch between enrolling in an accredited degree program and beginning to pursue licensure by applying for an NCARB Record.
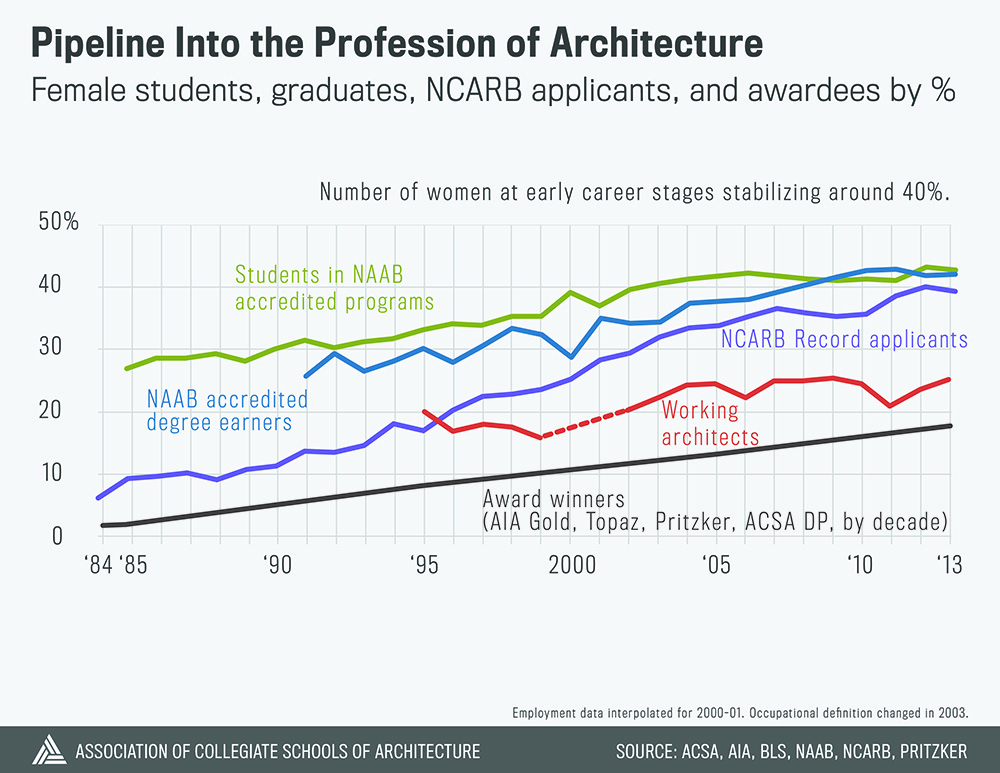
Moving on to the red line, which measures those working as architects or unlicensed architectural designers as measured by the BLS, we can see that practice may be where the gender gap widens. While the BLS is cautious about certain analyses based on time series data (in part because they occasionally adjust their occupational definitions), even with a sizable margin of error it is clear that there are far fewer women in practice than in school. This seems to be a “leaky pipeline” problem rather than a simple delay, because while the number of female students and graduates has stabilized at around 40% in recent years, the number of women working in architect roles has also stopped increasing, and has not gone much higher than 25%.
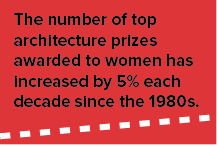
The gray line at the bottom represents the winners of the four awards we’re tracking (AIA Gold Medal, Topaz Medallion, Pritzker Prize, and ACSA Distinguished Professor). With the share of awards going to women increasing by about 5% each decade, if we continue at this pace we’ll be waiting until 2080 to see a 50-50 split.
Kendall Nicholson
Director of Research + Information
202-785-2324
knicholson@acsa-arch.org

 Study Architecture
  ProPEL