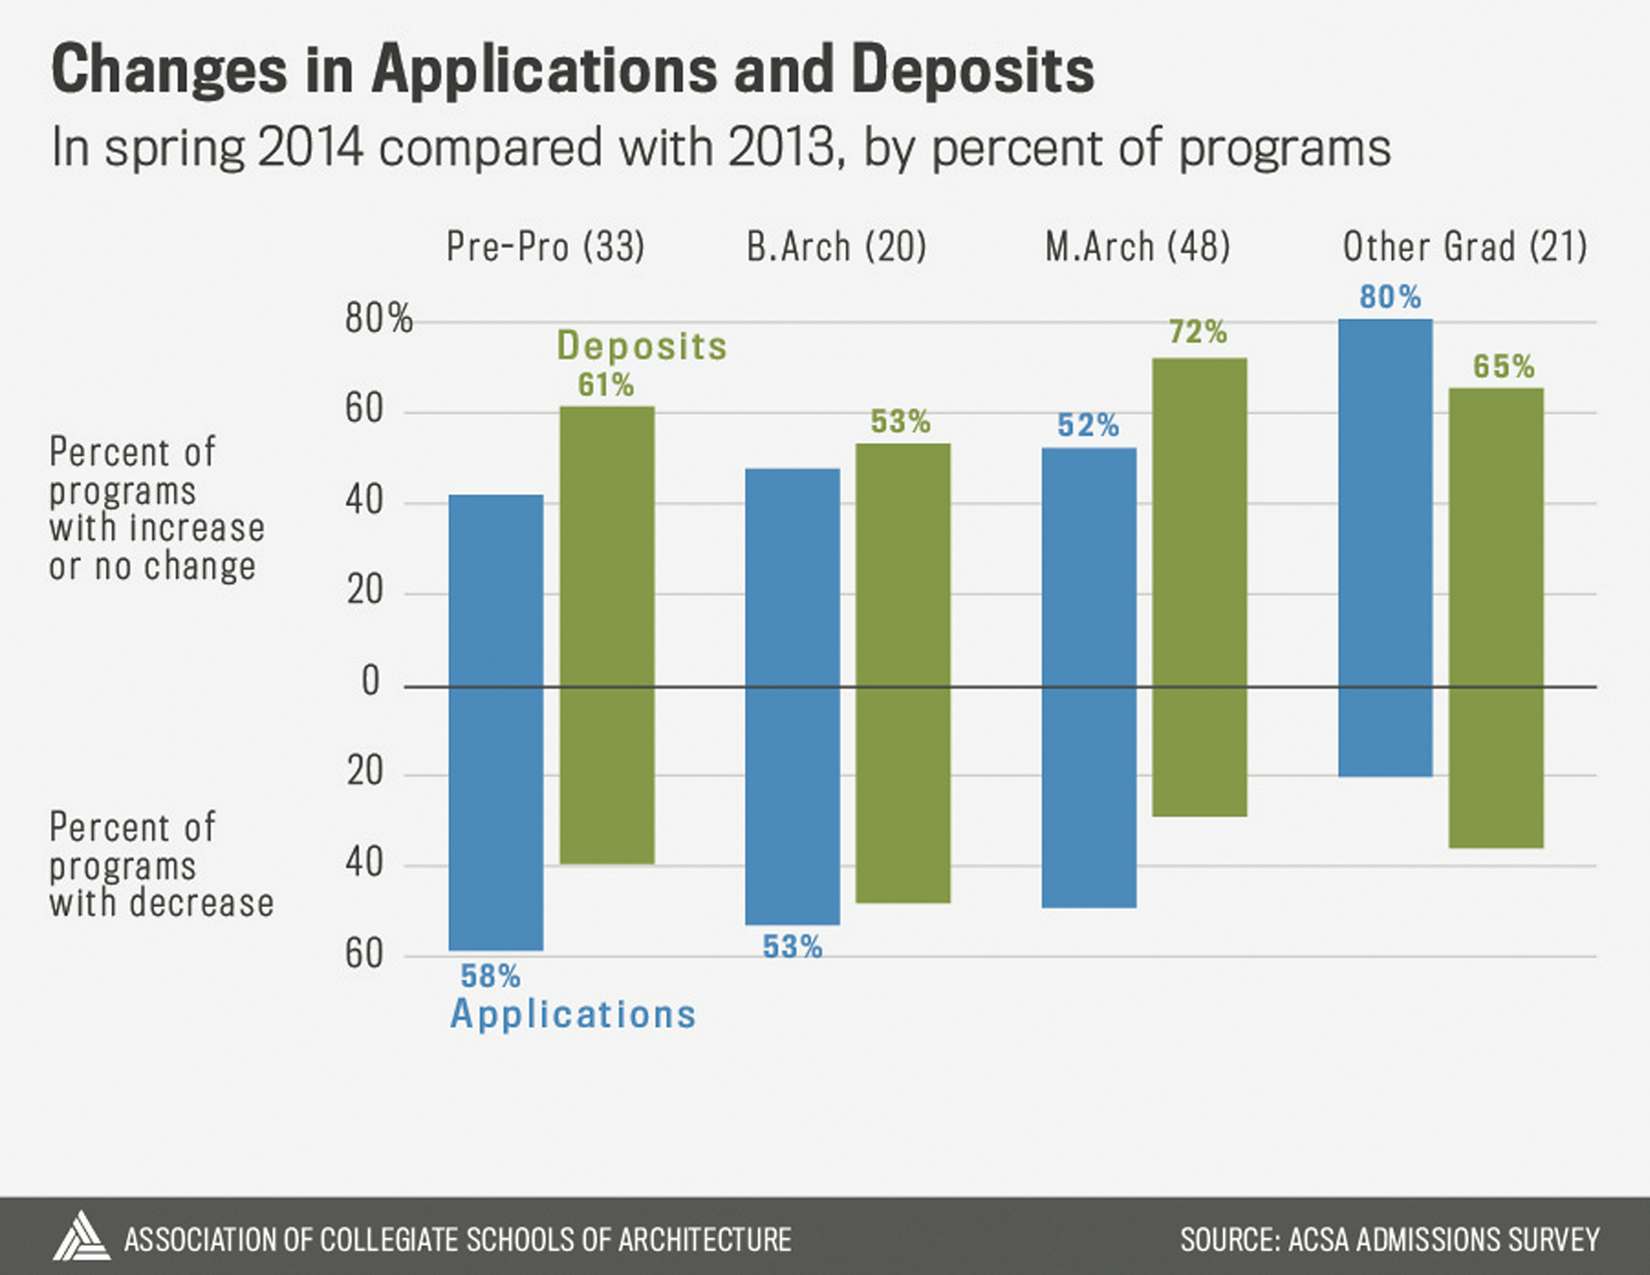
Undergraduate Applications are down, while Deposits are up for all Program Levels
Applications at the pre-professional and B.Arch levels are more often down than up as of May 2014, while deposits are more often up across all program levels, according to a survey of ACSA members.
Graduate programs are reporting increases, with 72% of responding M.Arch programs seeing an increase in deposits and 80% of non-accredited (i.e. post-professional) graduate programs seeing an increase in applications.
To put this data in context, enrollment across all higher education majors and programs has been slightly down in recent years, with total fall enrollments in 2012 off by nearly 2% as compared with a peak of over 21 million students in 2010, according to the National Center for Education Statistics.
Within architecture, according to data published in the National Architectural Accrediting Board’s annual reports, the change in enrollments for this same time period ranges from -9% at the pre-professional level, to -13% at the B.Arch level, and +2% at the M.Arch and D.Arch levels.
Published statistics from NCES and NAAB for the 2013-14 and 2014-15 academic years are not yet available, so this ACSA admissions survey is meant to provide a more current, if necessarily incomplete, snapshot. This report covers the main trends apparent in data captured from 122 programs in 55 institutions, or 40% of ACSA’s membership.
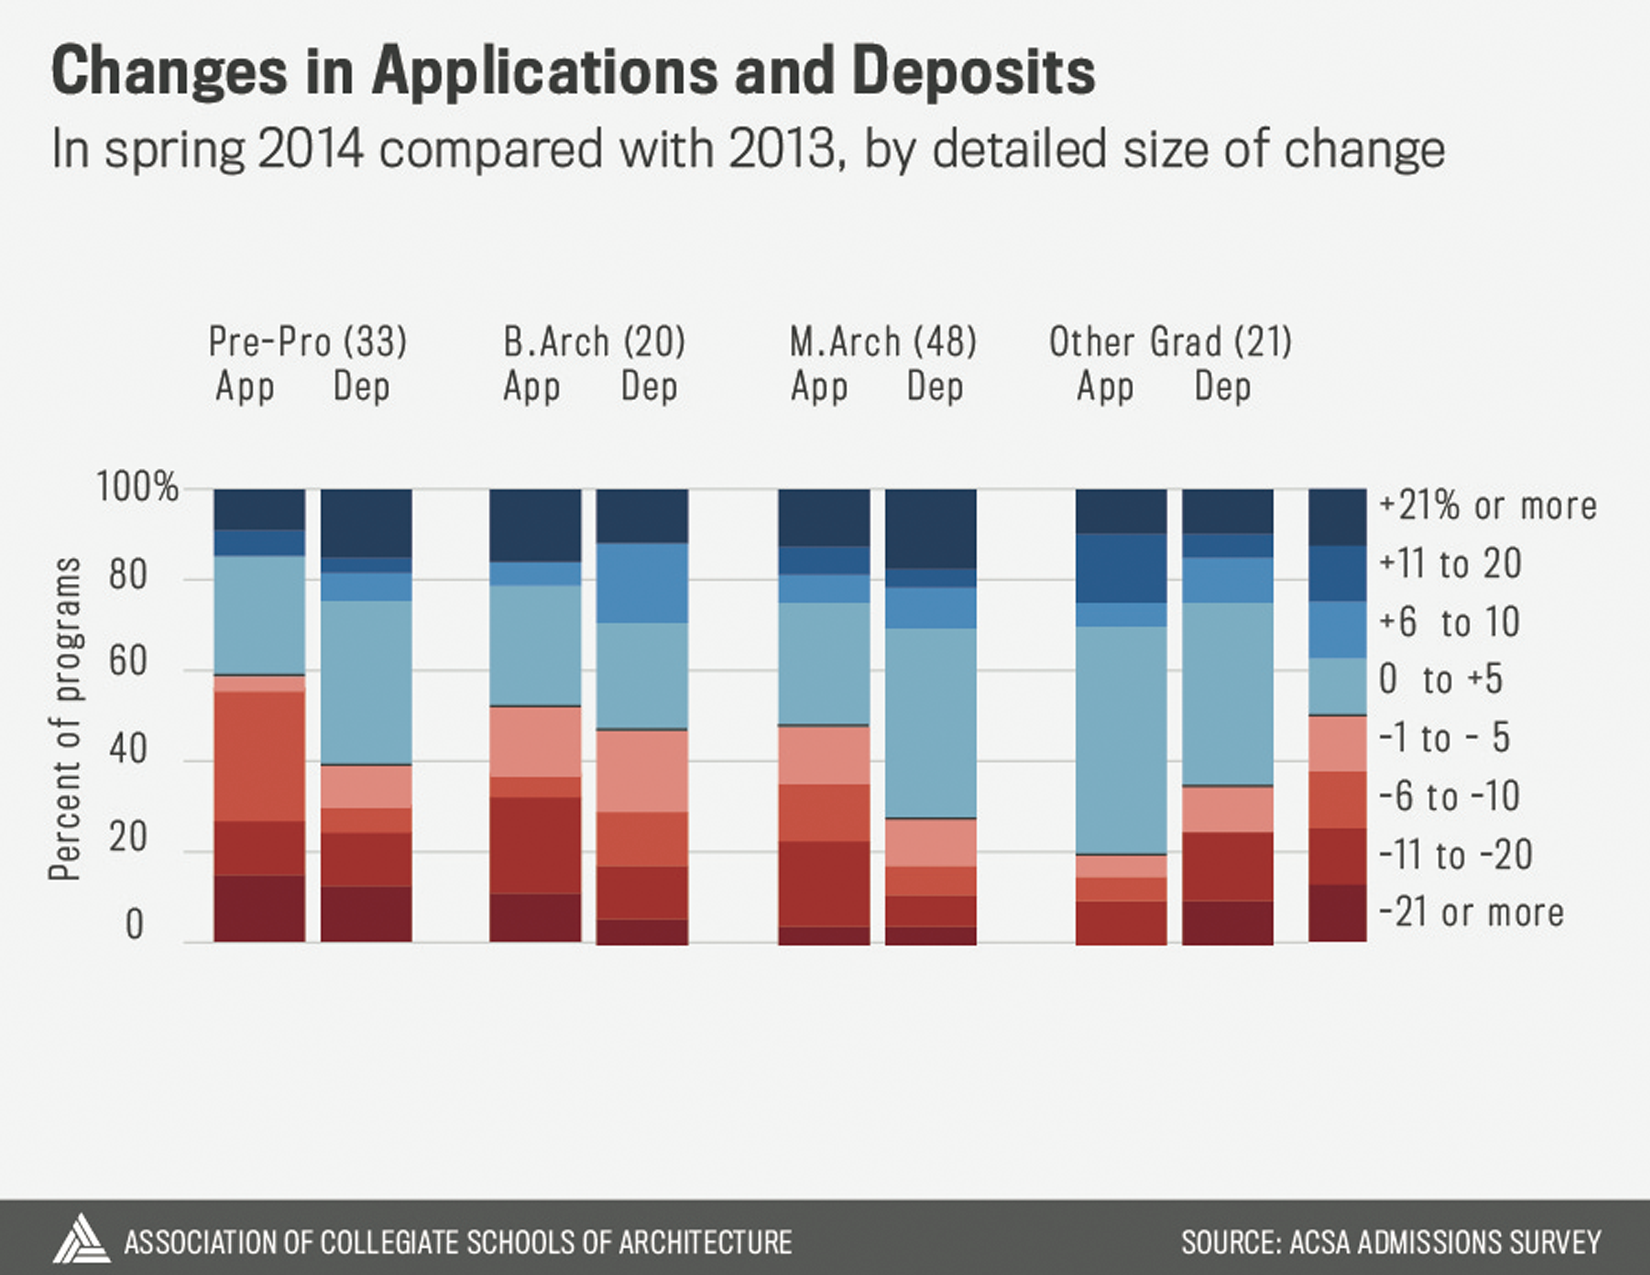
Small Changes Most Common
First, while deposits are up for most schools at all program levels, and applications are up for most schools at the graduate level, this finding is tempered in the breakdown by detailed size of change. In the above chart, the pale blue bands indicate programs reporting 0 to +5% in applications or deposits, the most common response. On the other hand, for programs reporting decreases, moderate to large decreases (greater than 5%) were reported more often.
We analyzed survey results according to a range of institutional characteristics shared by NCES and the Carnegie Foundation, and few clear patterns emerged. Carnegie Classification, Locale (urban or rural setting), selectivity, total enrollment, percent of undergraduate students who are part time, net institutional tuition cost, and other factors that we considered do not correlate strongly with increasing or decreasing application or deposit numbers. We did, however, find patterns related to region and institutional funding.
Considerable Variations by Region
There is considerable variation by region, ranging from deposits being down at 56% of responding programs in the Northeast to deposits being up for 93% of responding programs in Mid-Atlantic. While this may not reflect the situation at ACSA programs overall, this was a clear pattern among those programs responding to this survey.
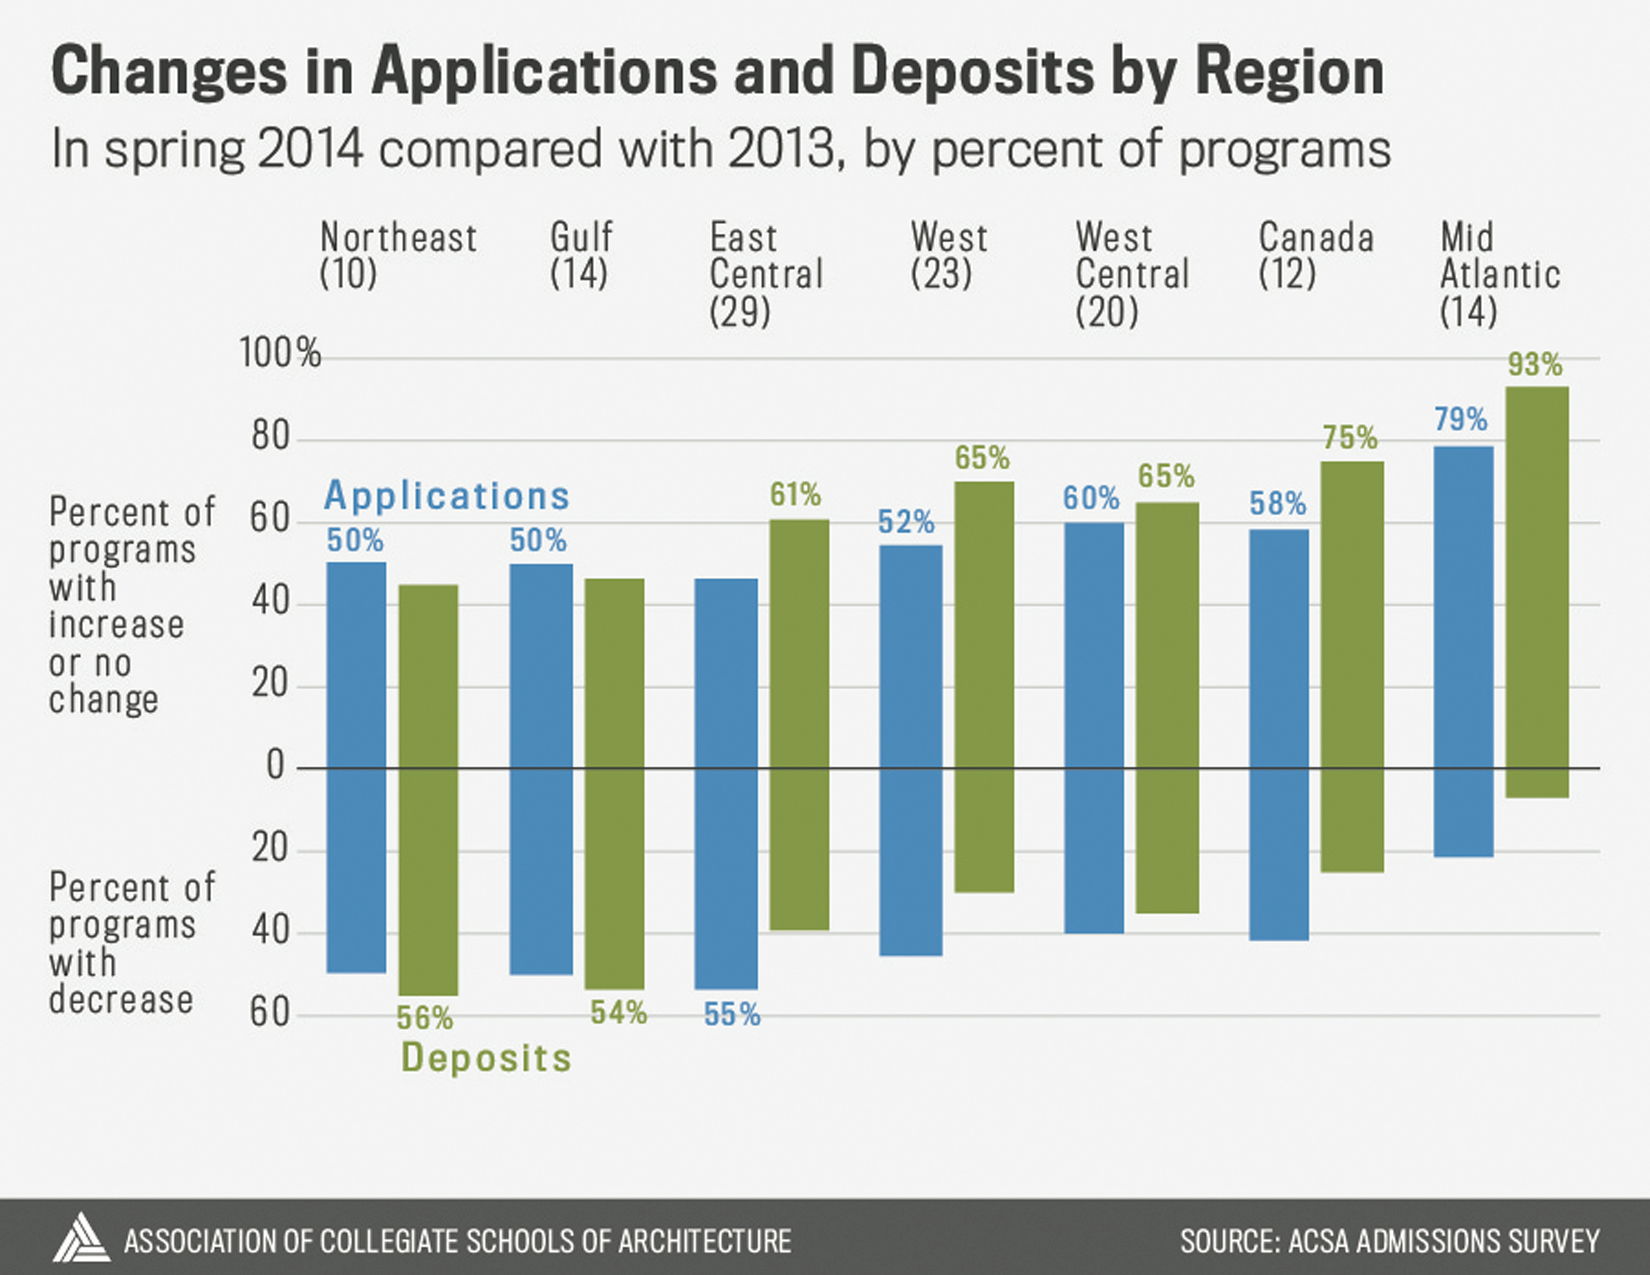
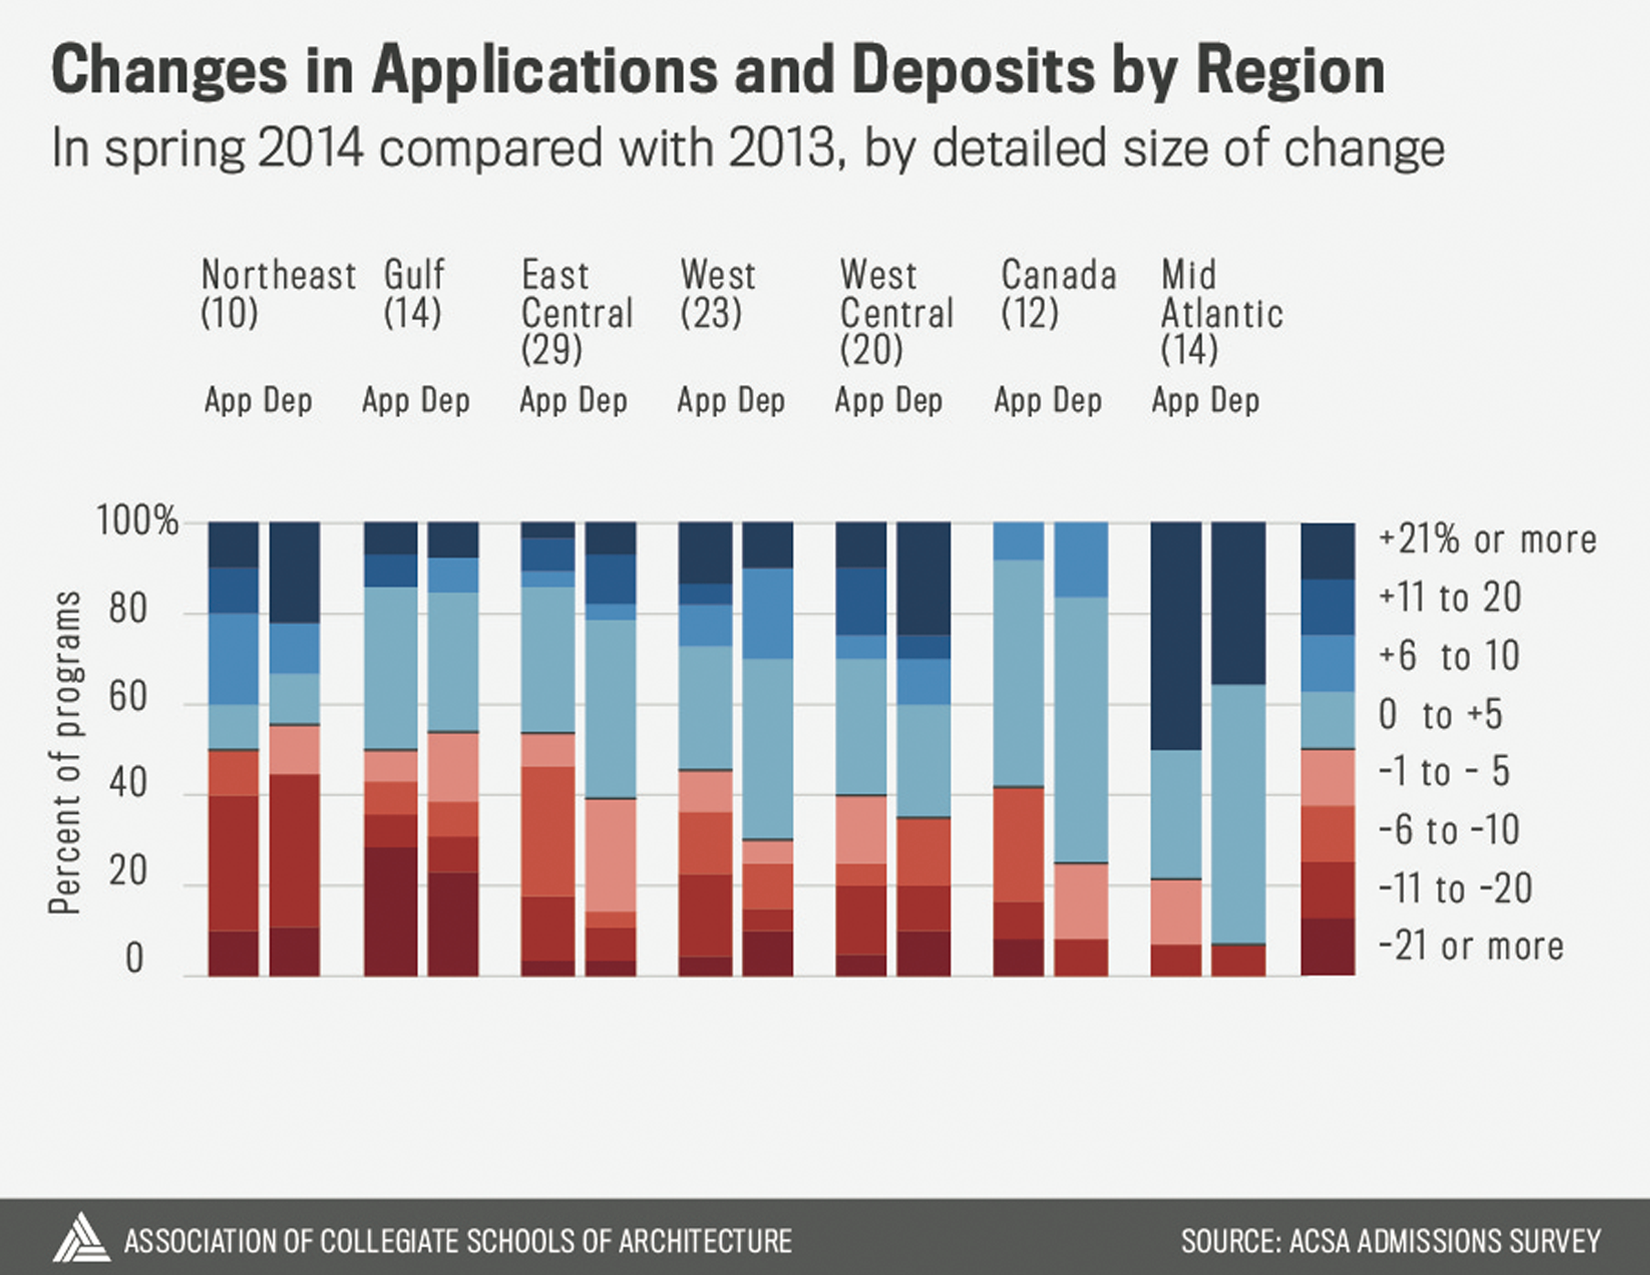
The regional breakdown by detailed size of change shows that responding programs in the Mid-Atlantic are not only seeing increases, but often very large increases of +21% or more. On the other hand, a majority of Canadian schools reported flat or increasing applications and deposits, but the increases were moderate, from 0 to +10%.
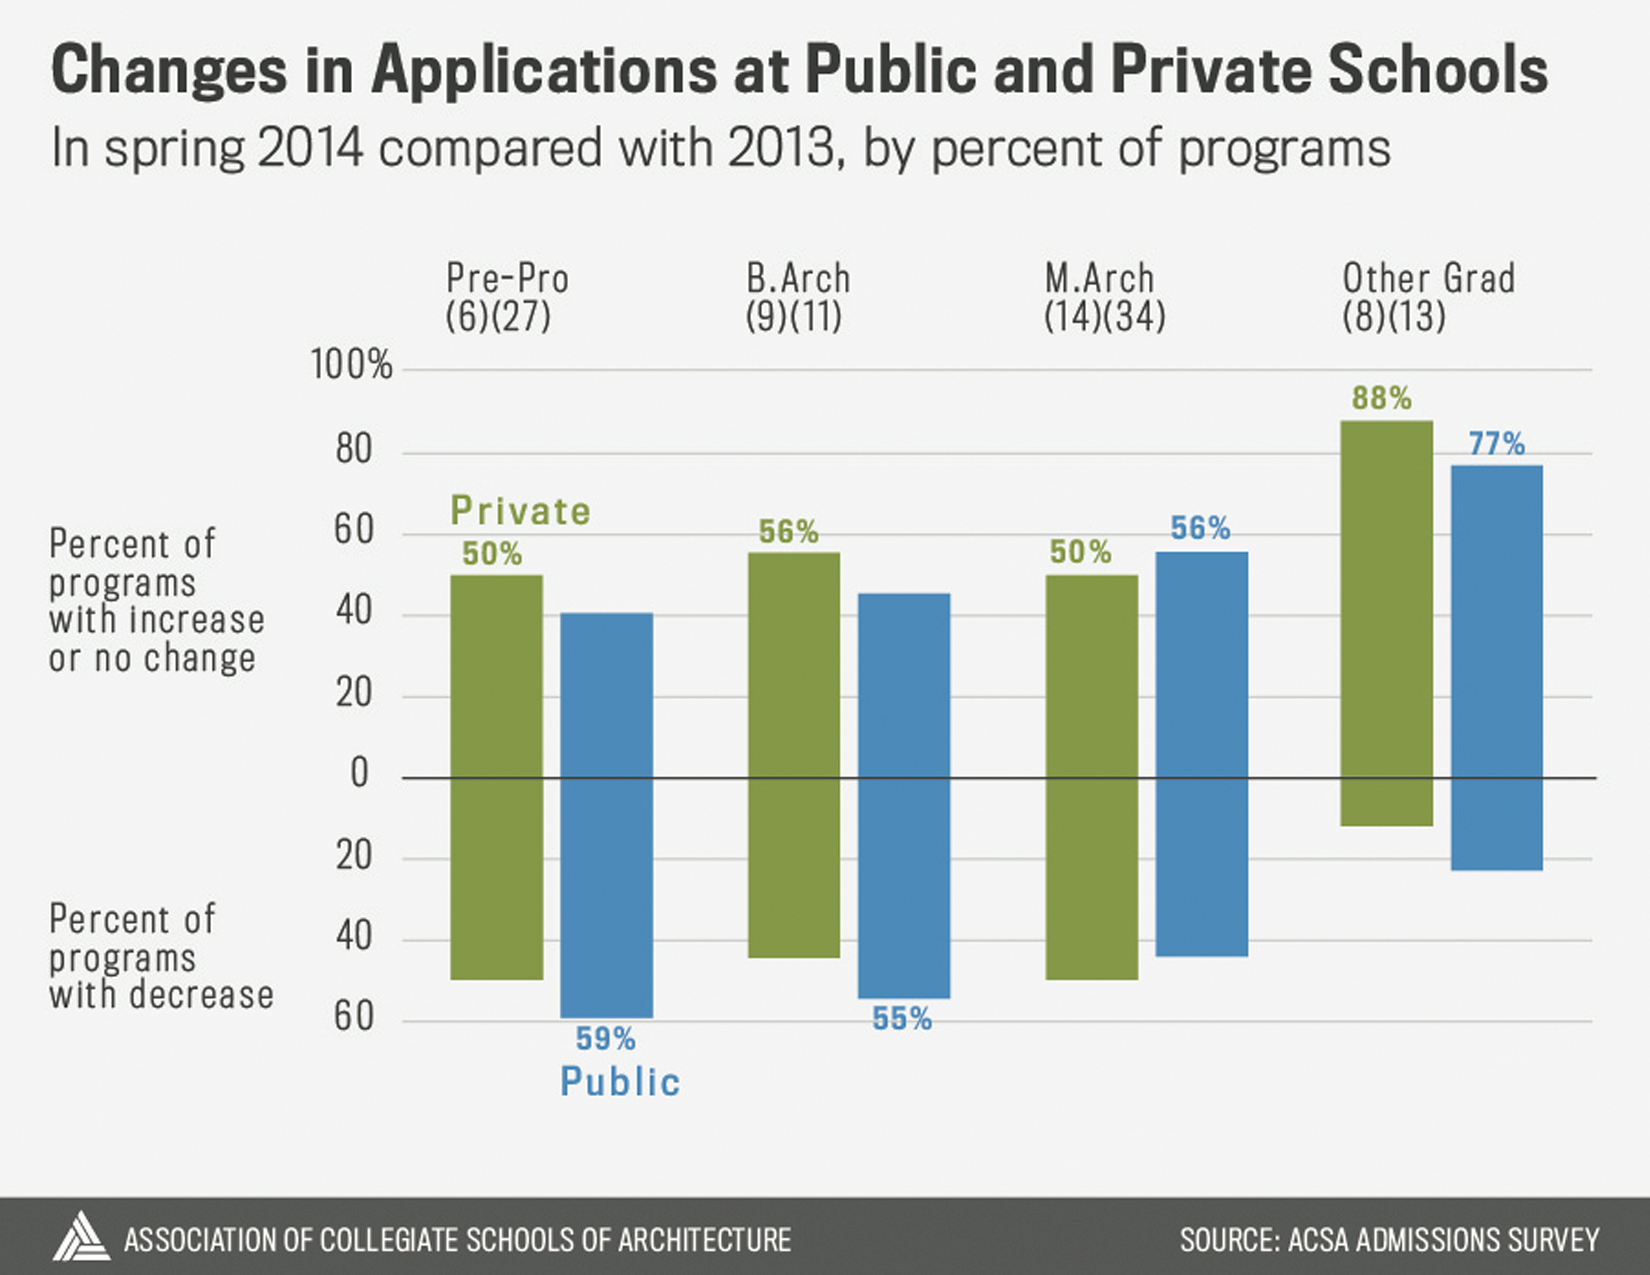
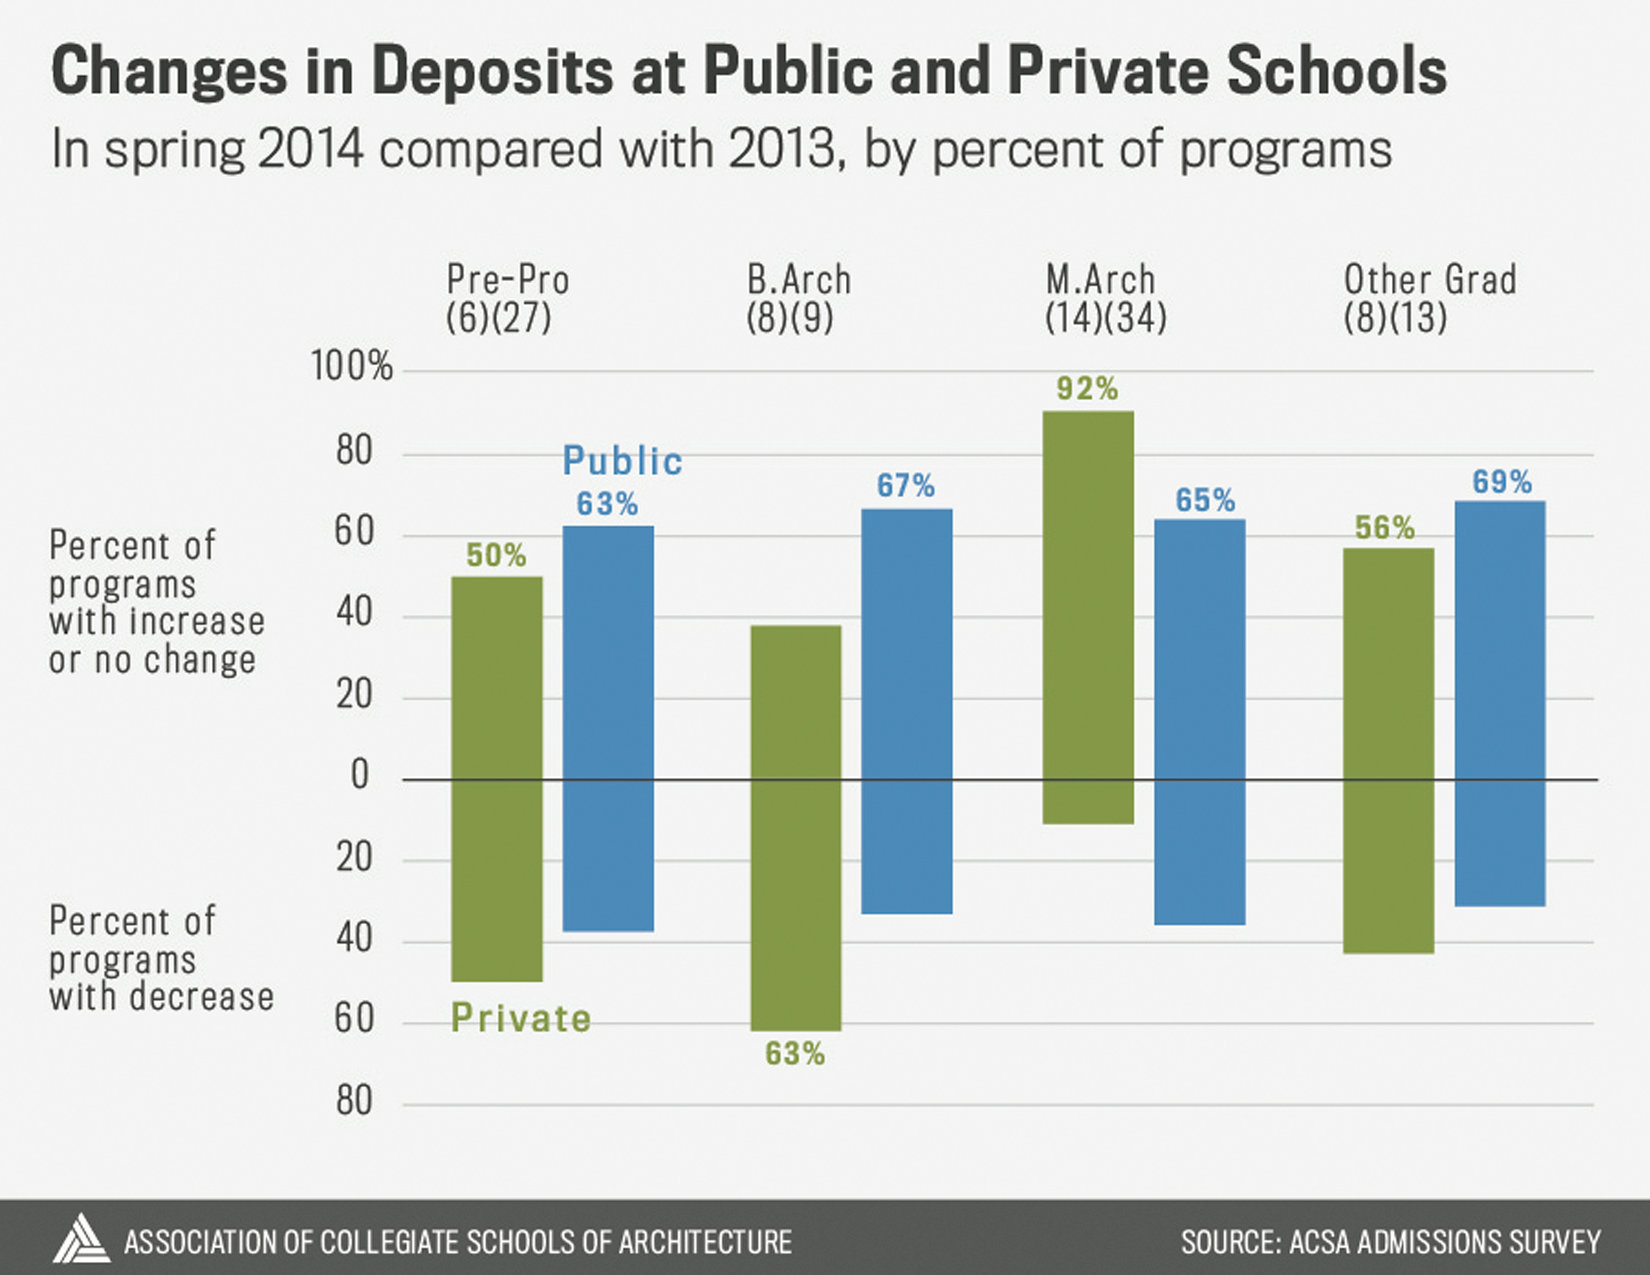
Applications Increase at Private Institutions
The next two charts compare public and private institutions. Across all program levels, responding private schools are seeing increases in applications more often than their public counterparts, but at all program levels except for the M.Arch, responding public schools are more often seeing increases in deposits.
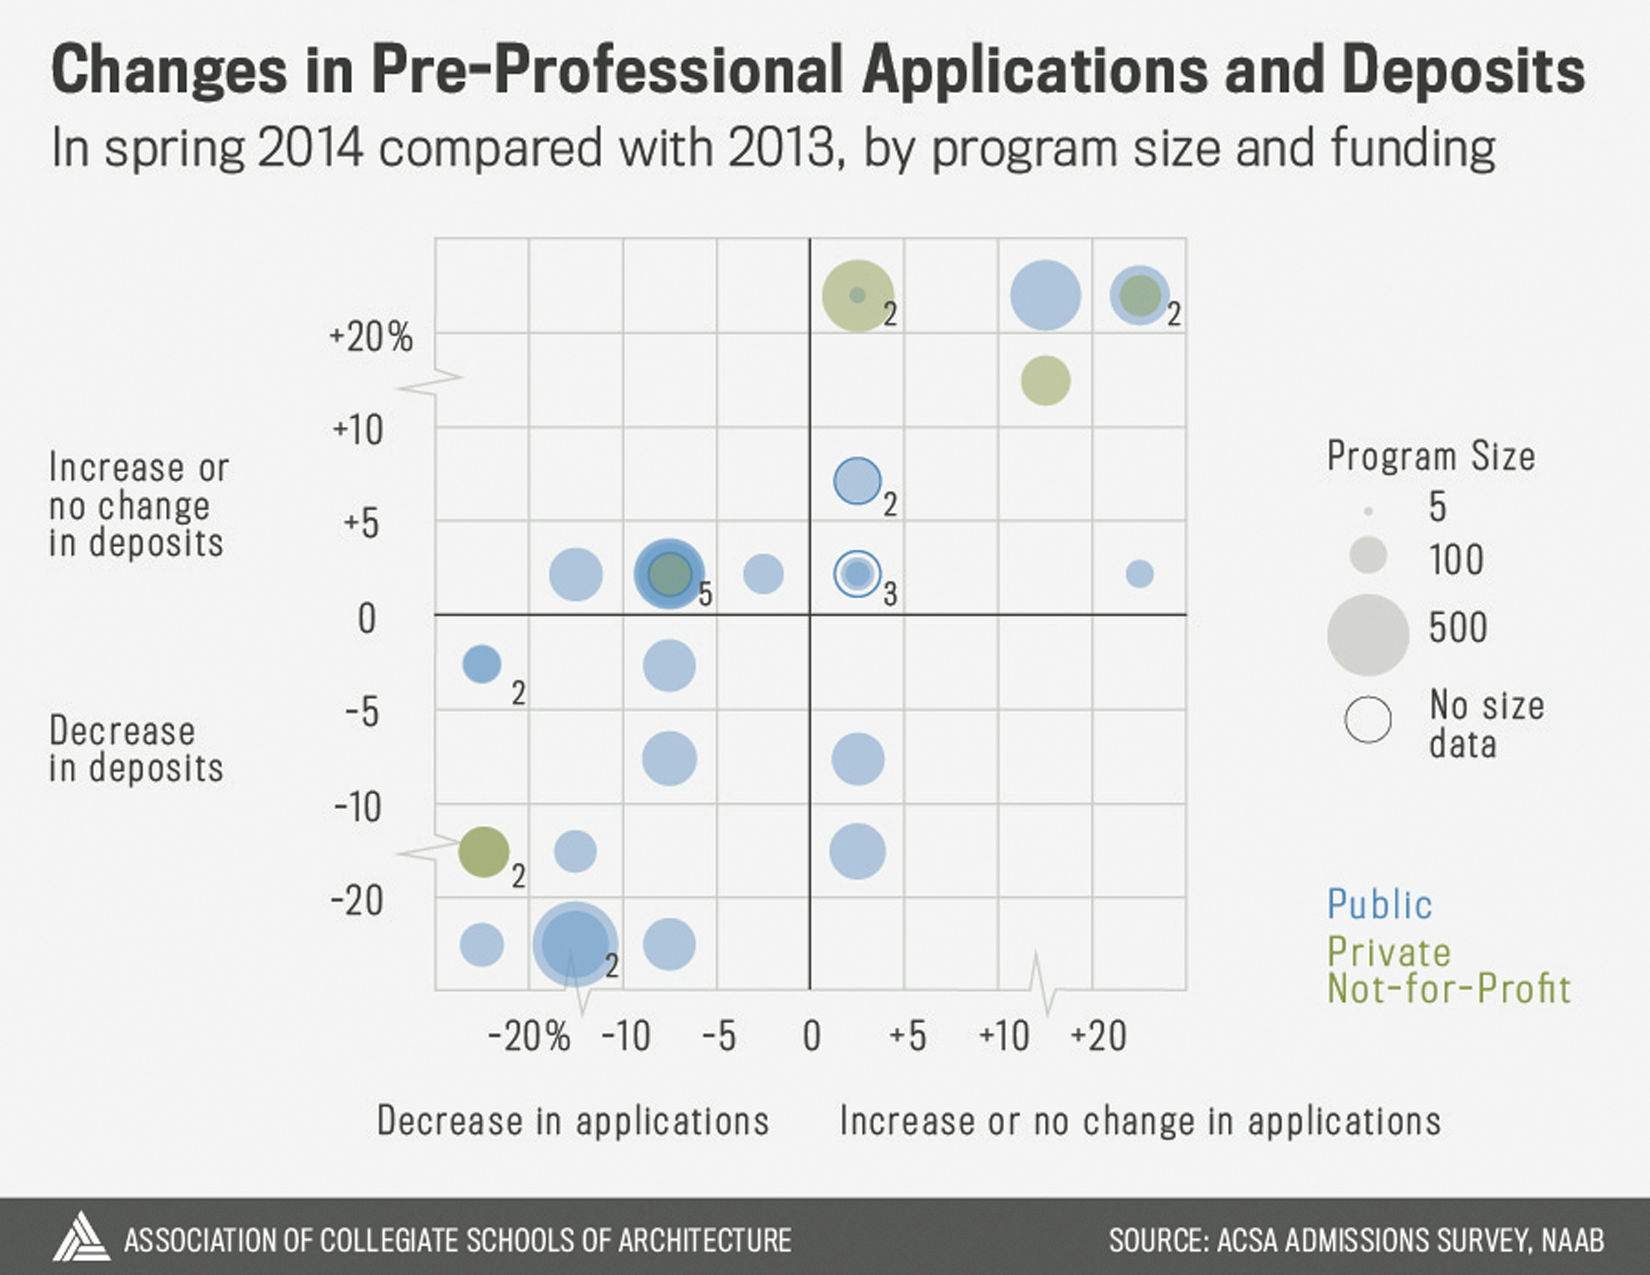
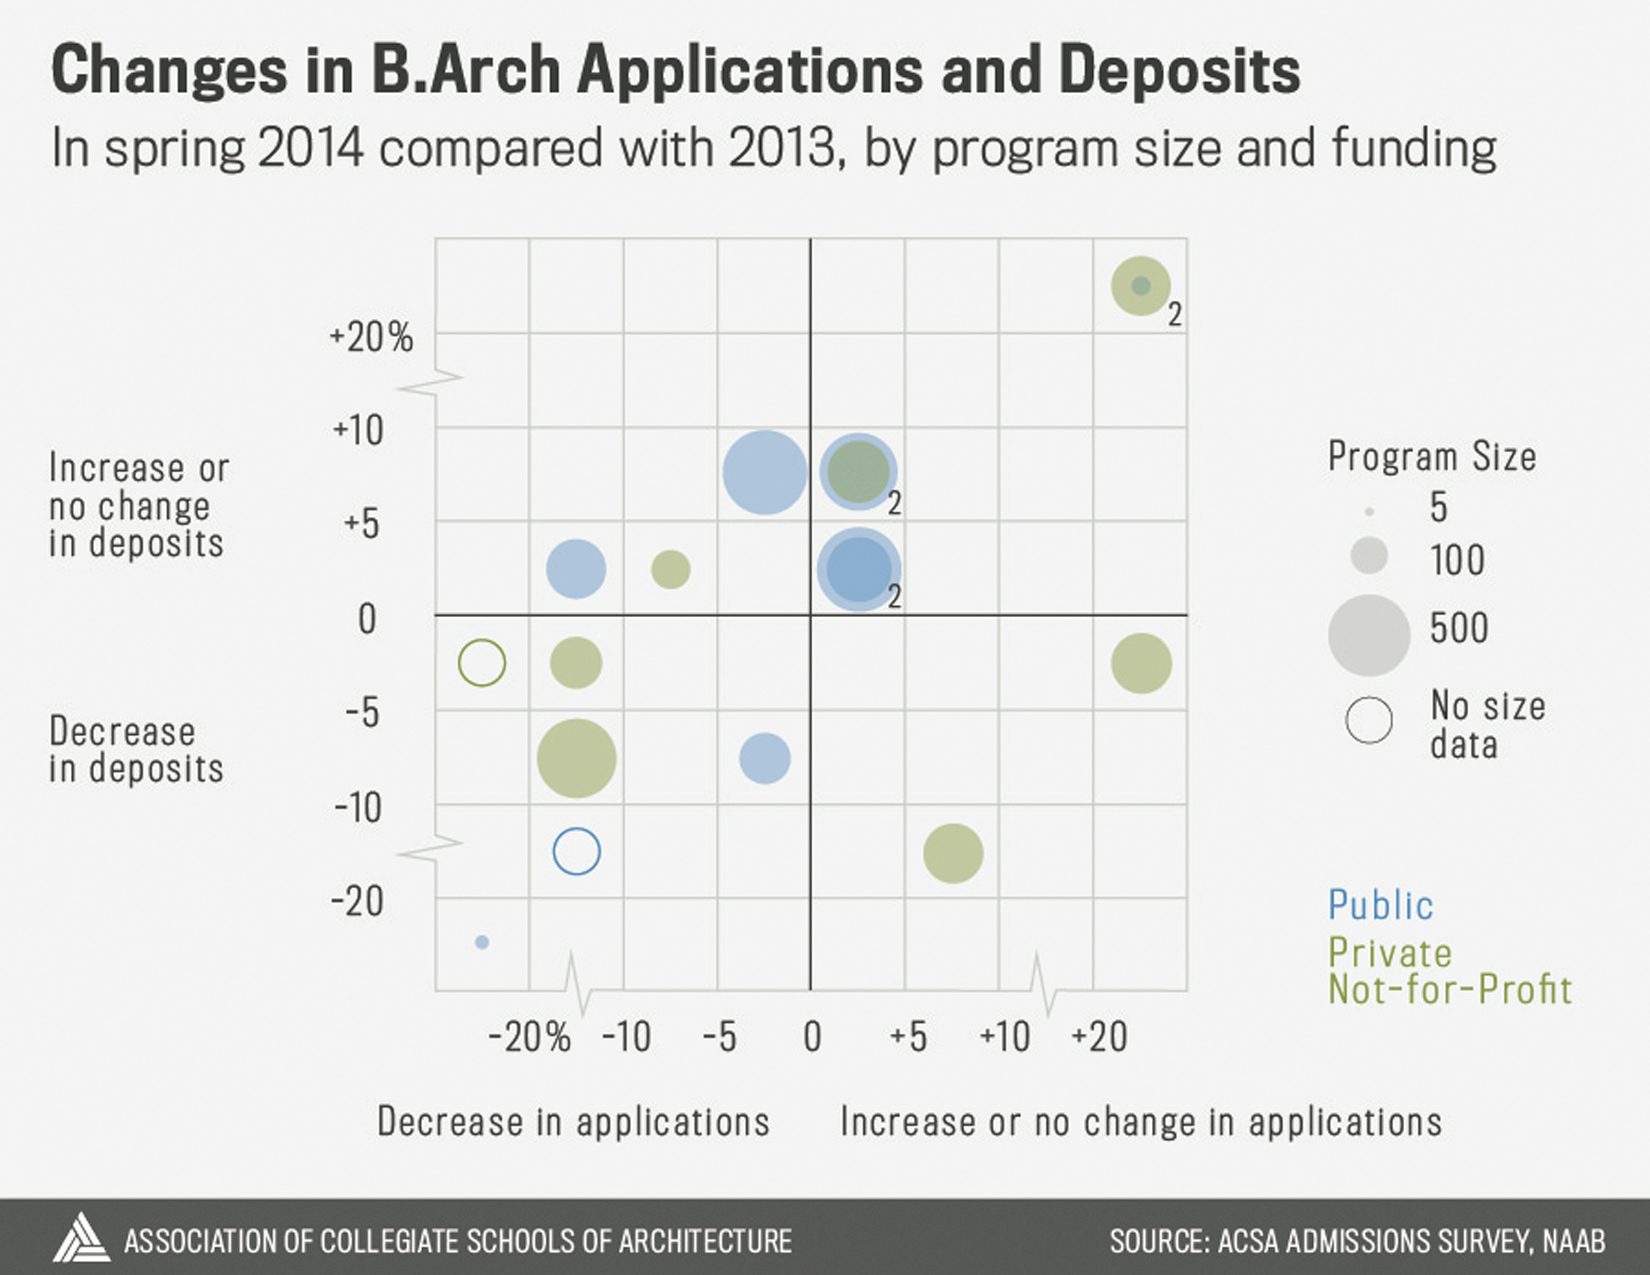
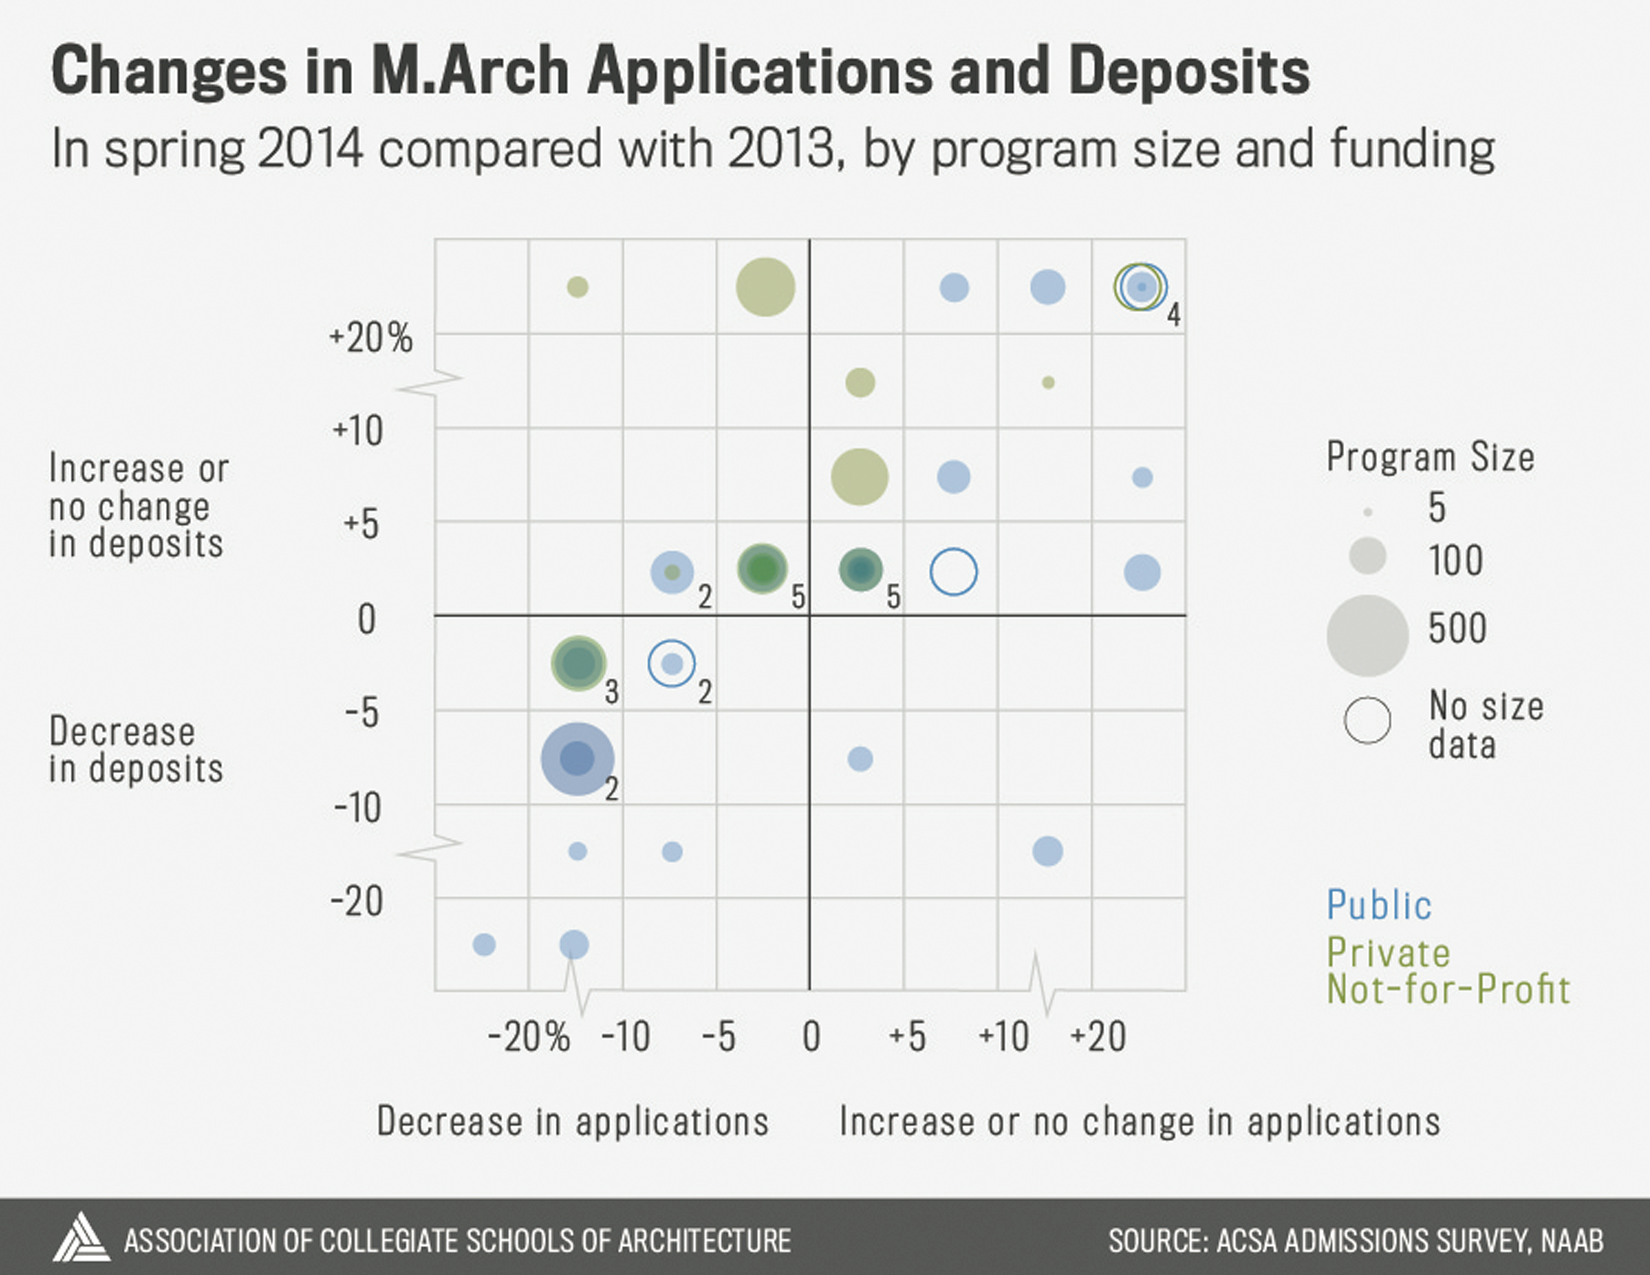
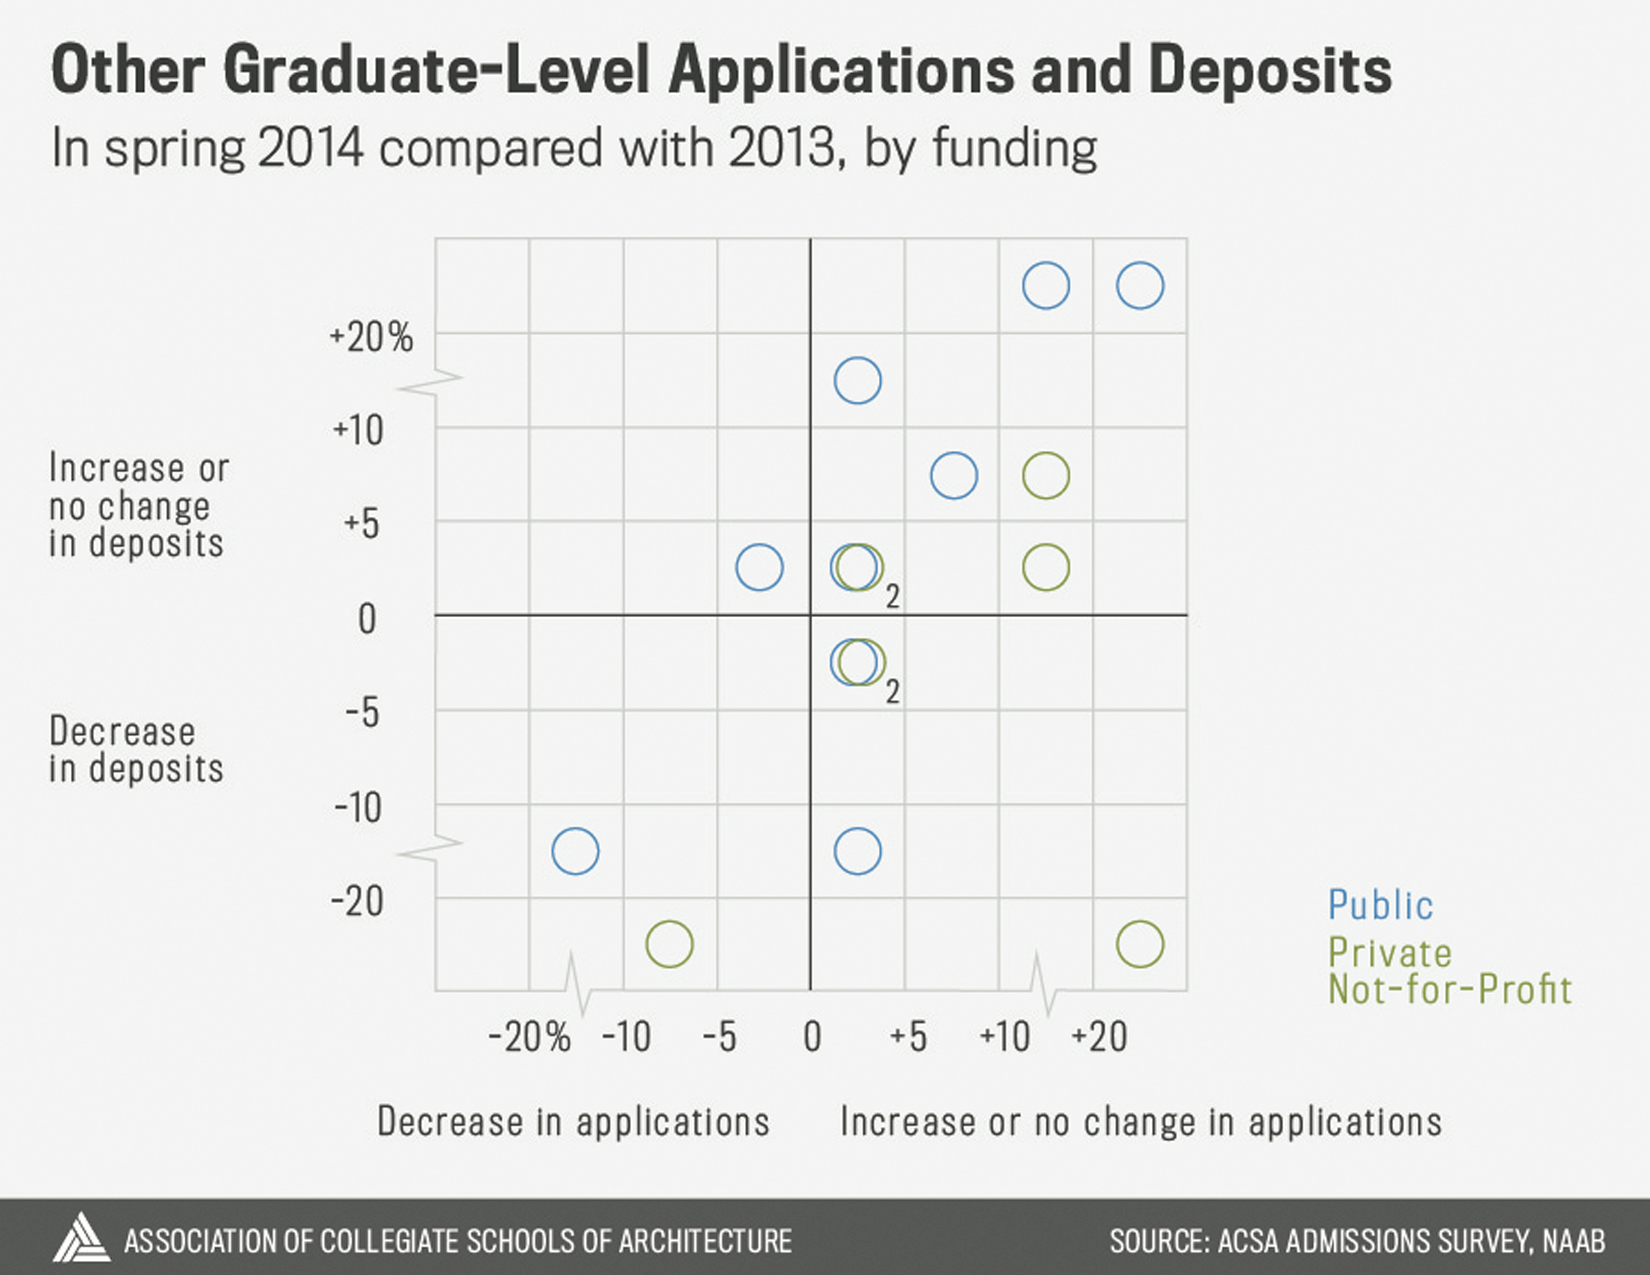
Do these patterns hold for both large and small programs? The next four charts provide a school-by-school view for each respondent reporting both deposit and application data, plotting change in deposits over change in applications. Each circle indicates a program, with the program’s size (according to NAAB statistics for the 2012-13 academic year) reflected in the circle’s size and the funding type indicated by its color.
Several pre-professional programs saw a decrease in applications but flat or increasing deposits, and the largest changes in M.Arch application and deposit numbers are being reported by programs with smaller overall enrollments.
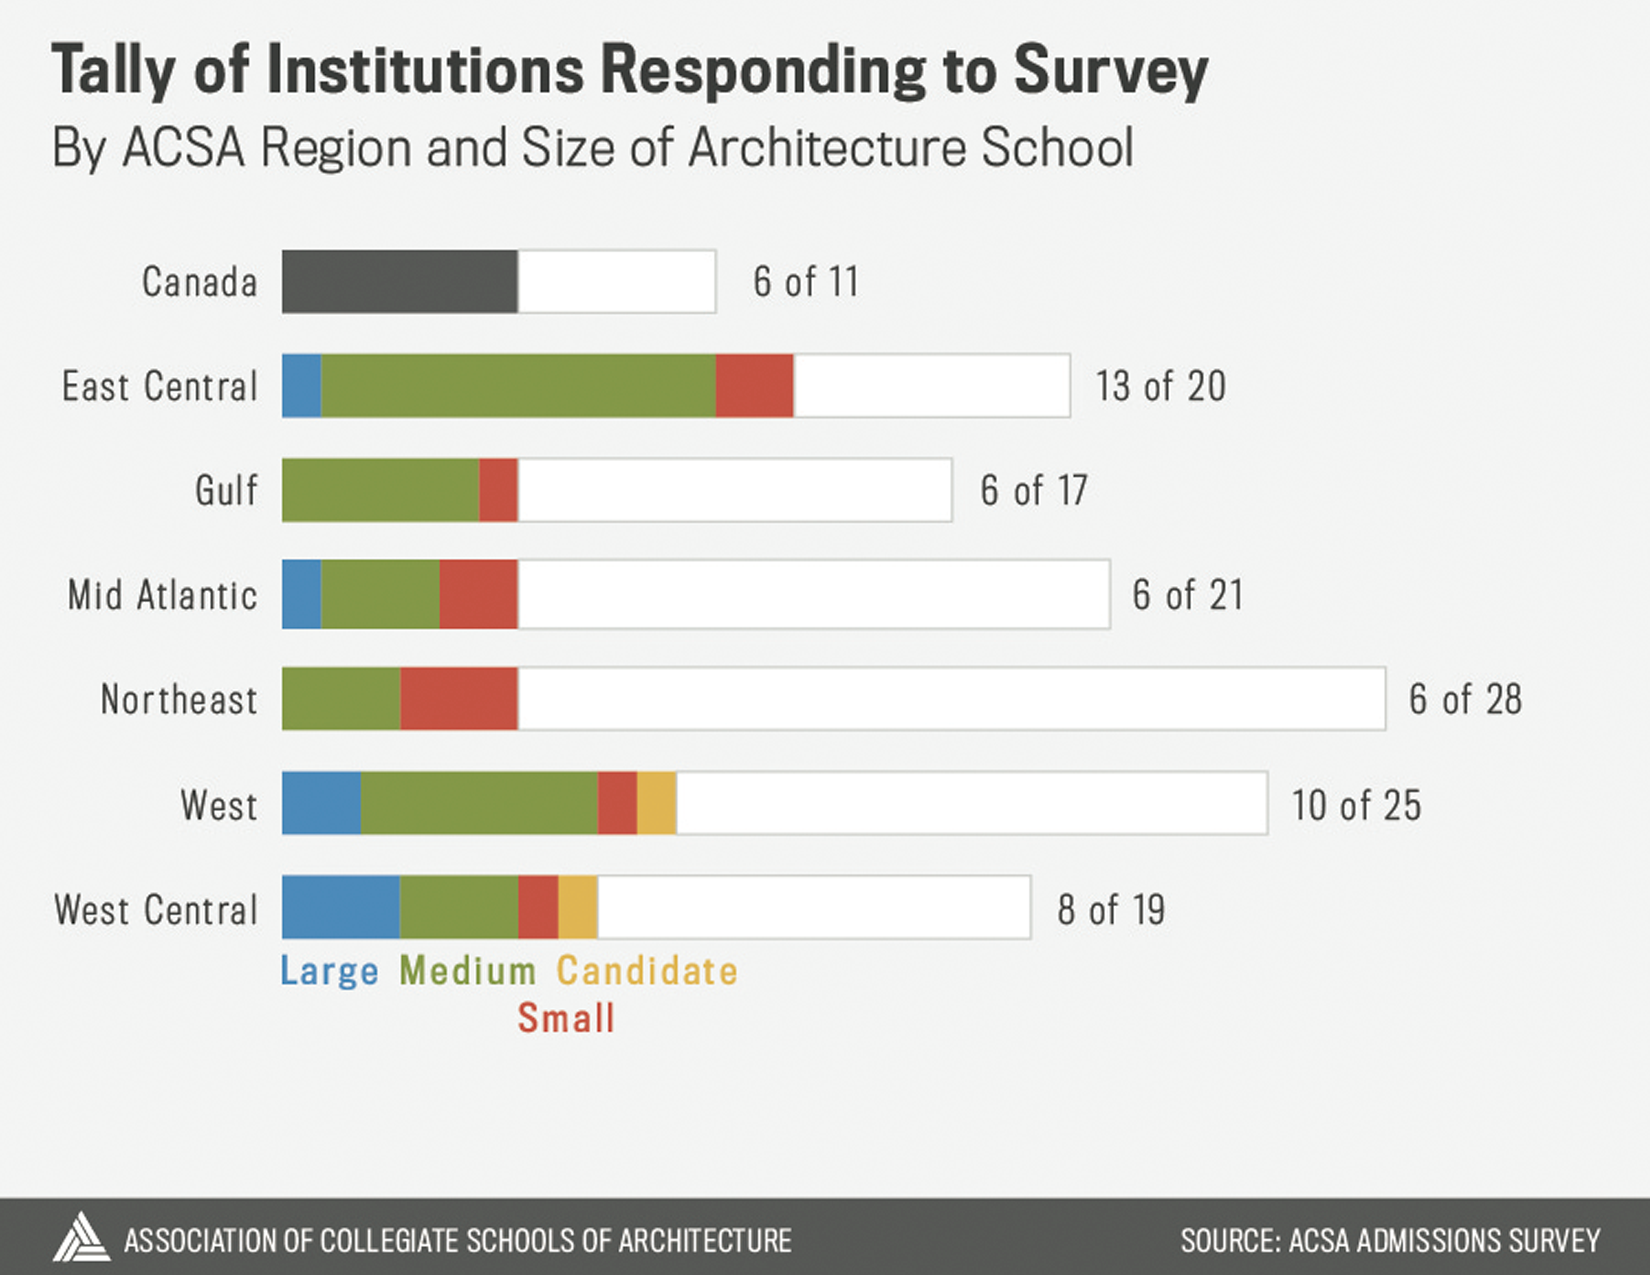
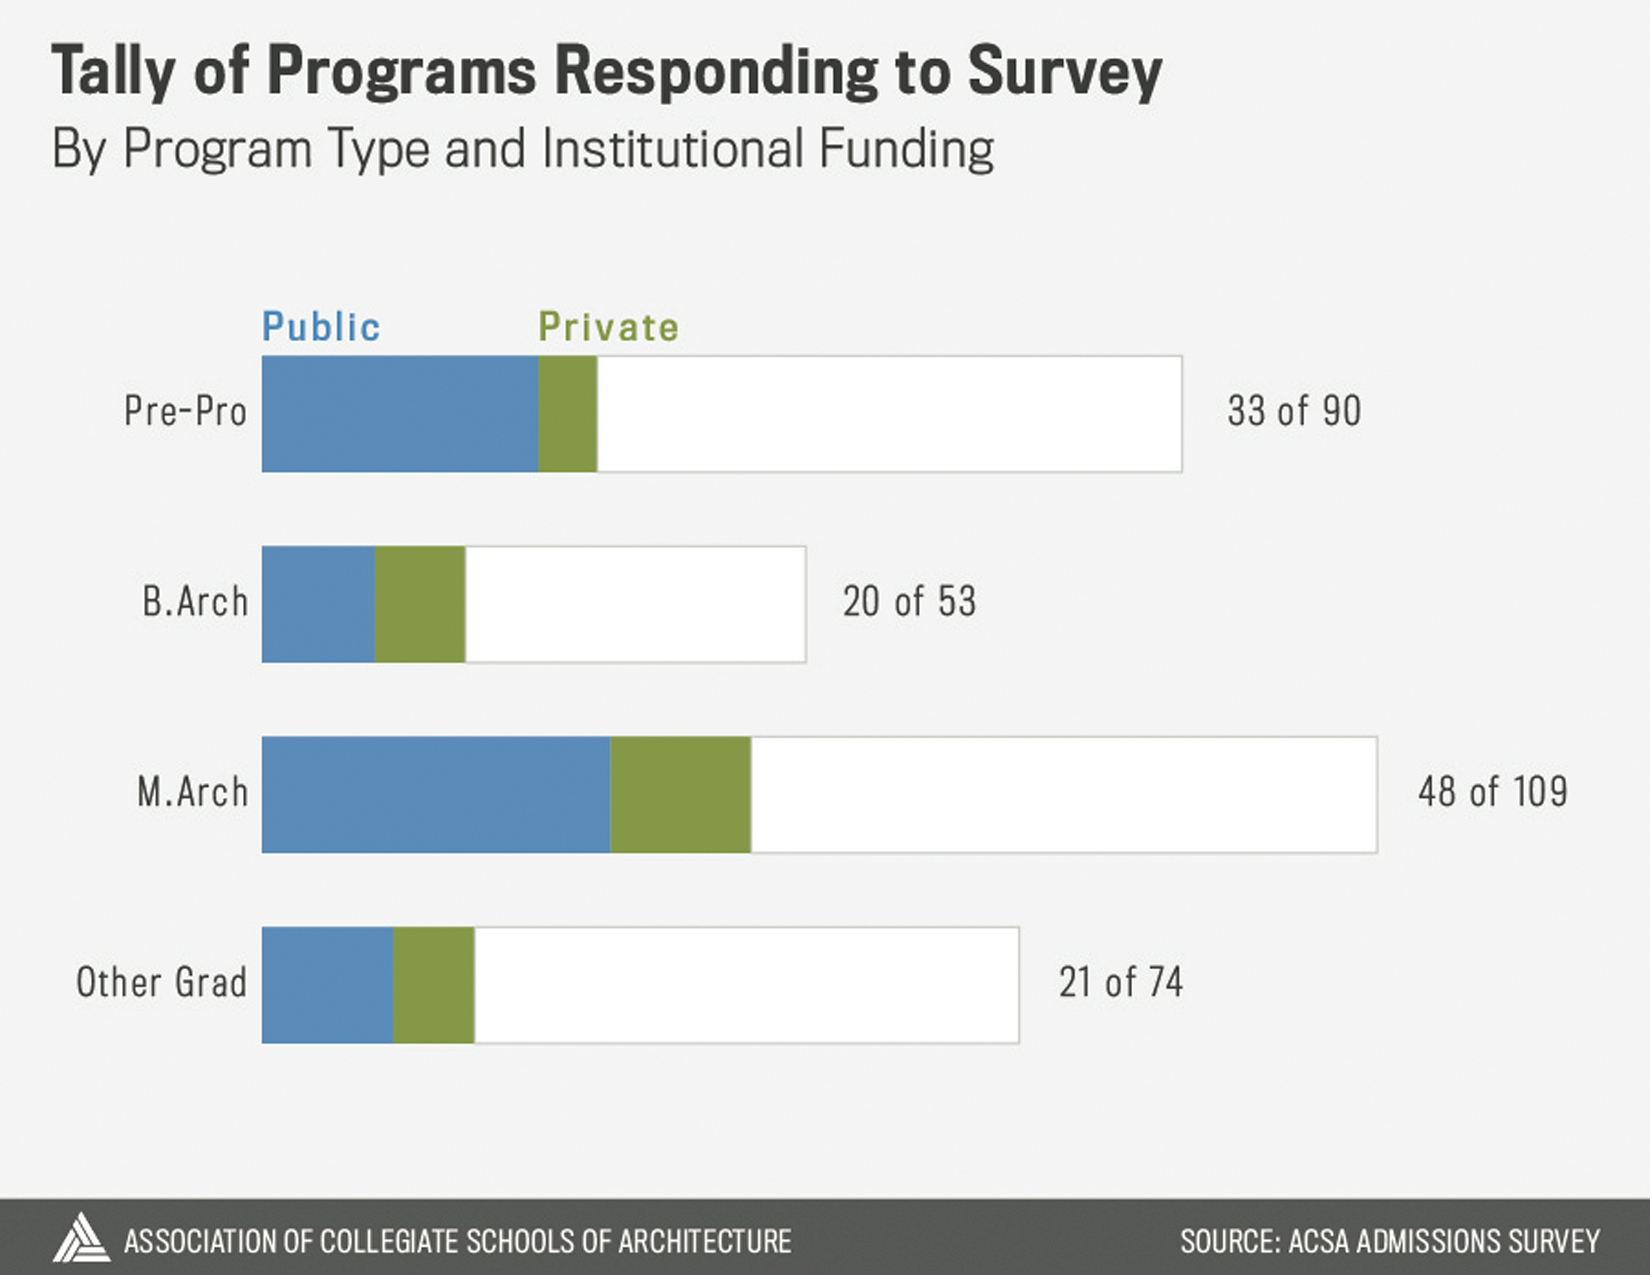
The final two charts show the tally of institutions and programs responding to this survey, which was distributed by email to administrators at ACSA’s 141 full, candidate, and Canadian member institutions. A total of 55 institutions housing 122 programs, or 40% of ACSA’s total membership, shared their data. As this is far from full coverage and we have not corrected for a selection bias (in which schools seeing increases or decreases have been more or less likely to participate), please keep in mind that the data are not necessarily representative of ACSA schools overall.
The ACSA thanks all schools who participated by sharing their data. Do you have questions about the methodology or data, or suggestions for future surveys? Contact Kendall Nicholson, Director of Research + Information.
If you are an administrator at an ACSA member school and want to make sure that you don’t miss out on future calls for participation, please contact the Danielle Dent at 202.785-2324 or ddent@acsa-arch.org to make sure your school’s contact information is up to date.
Kendall Nicholson
Director of Research + Information
202-785-2324
knicholson@acsa-arch.org
